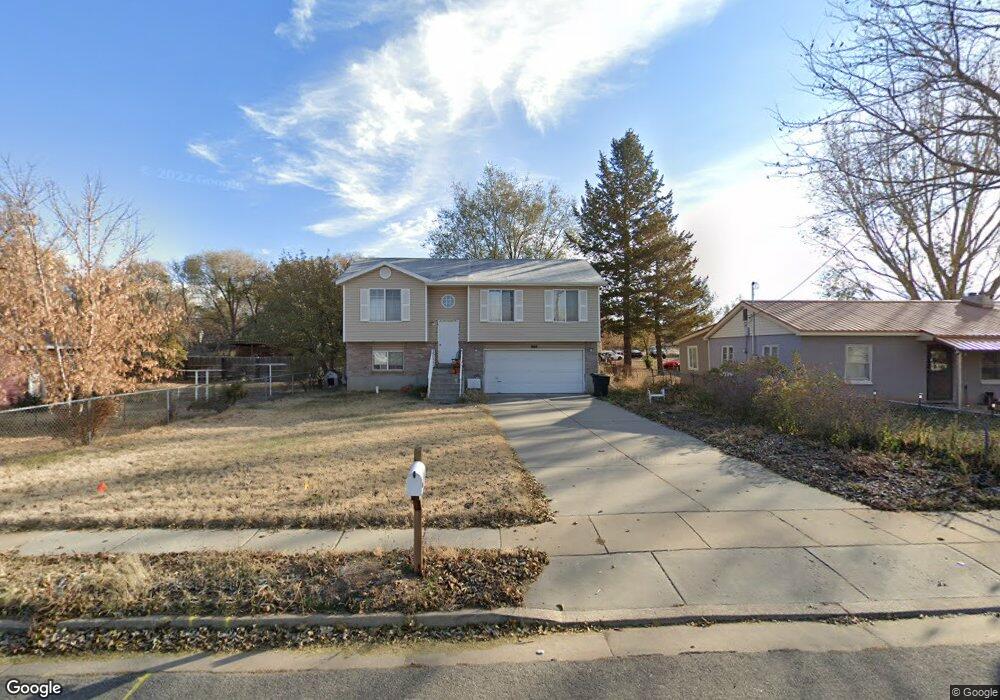
868 N 1000 W Clearfield, UT 84015
Estimated Value: $387,000 - $459,000
3
Beds
1
Bath
1,039
Sq Ft
$403/Sq Ft
Est. Value
About This Home
This home is located at 868 N 1000 W, Clearfield, UT 84015 and is currently estimated at $418,998, approximately $403 per square foot. 868 N 1000 W is a home located in Davis County with nearby schools including Clinton Elementary School, Sunset Junior High School, and Clearfield High School.
Ownership History
Date
Name
Owned For
Owner Type
Purchase Details
Closed on
May 31, 2001
Sold by
Mark Higley Construction Lc
Bought by
Hubenthal John and Hubenthal Suzette O
Current Estimated Value
Home Financials for this Owner
Home Financials are based on the most recent Mortgage that was taken out on this home.
Original Mortgage
$114,821
Outstanding Balance
$43,255
Interest Rate
7.15%
Mortgage Type
FHA
Estimated Equity
$375,743
Purchase Details
Closed on
Oct 20, 2000
Sold by
Reyna Pedro
Bought by
Mark Higley Construction Lc
Home Financials for this Owner
Home Financials are based on the most recent Mortgage that was taken out on this home.
Original Mortgage
$80,800
Interest Rate
7.96%
Mortgage Type
Construction
Purchase Details
Closed on
Sep 15, 2000
Sold by
Reyna Pedro
Bought by
Reyna Pedro
Home Financials for this Owner
Home Financials are based on the most recent Mortgage that was taken out on this home.
Original Mortgage
$80,800
Interest Rate
7.96%
Mortgage Type
Construction
Create a Home Valuation Report for This Property
The Home Valuation Report is an in-depth analysis detailing your home's value as well as a comparison with similar homes in the area
Home Values in the Area
Average Home Value in this Area
Purchase History
| Date | Buyer | Sale Price | Title Company |
|---|---|---|---|
| Hubenthal John | -- | Heritage West Title Insuranc | |
| Mark Higley Construction Lc | -- | Heritage West Title Insuranc | |
| Reyna Pedro | -- | -- |
Source: Public Records
Mortgage History
| Date | Status | Borrower | Loan Amount |
|---|---|---|---|
| Open | Hubenthal John | $114,821 | |
| Previous Owner | Mark Higley Construction Lc | $80,800 |
Source: Public Records
Tax History Compared to Growth
Tax History
| Year | Tax Paid | Tax Assessment Tax Assessment Total Assessment is a certain percentage of the fair market value that is determined by local assessors to be the total taxable value of land and additions on the property. | Land | Improvement |
|---|---|---|---|---|
| 2025 | $1,951 | $187,550 | $87,579 | $99,971 |
| 2024 | $1,980 | $191,400 | $94,553 | $96,847 |
| 2023 | $1,800 | $322,000 | $138,247 | $183,753 |
| 2022 | $1,918 | $189,750 | $80,011 | $109,739 |
| 2021 | $1,744 | $256,000 | $107,943 | $148,057 |
| 2020 | $1,508 | $219,000 | $96,097 | $122,903 |
| 2019 | $1,494 | $212,000 | $104,293 | $107,707 |
| 2018 | $1,363 | $190,000 | $87,090 | $102,910 |
| 2016 | $1,157 | $83,325 | $34,786 | $48,539 |
| 2015 | $1,177 | $80,575 | $34,786 | $45,789 |
| 2014 | $920 | $64,002 | $34,786 | $29,216 |
| 2013 | -- | $81,403 | $26,297 | $55,106 |
Source: Public Records
Map
Nearby Homes
- 1038 W 800 N
- 984 N 1100 W
- 853 W 700 N
- 690 Barlow St
- 620 N 1100 W
- 1121 N 900 W
- 721 N 800 W
- 1132 N 780 W
- 1242 W 1075 N
- 652 W 800 N Unit 131
- 652 W 800 N Unit 62
- 561 N 700 W
- 417 N 1200 W Unit 84
- 1337 W 550 N Unit 195
- 563 N 1350 W Unit 139
- 423 N 1250 W Unit 118
- 1350 W 300 N Unit 49
- 1350 W 300 N Unit 38
- 1350 W 300 N Unit 29
- 1122 N 1500 W