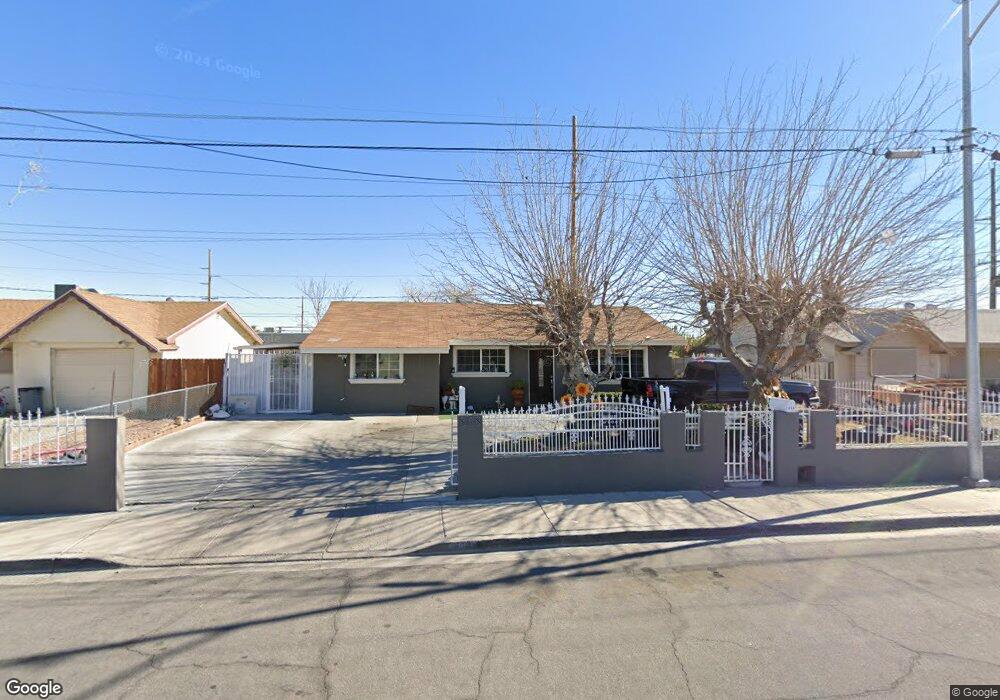
868 N 29th St Las Vegas, NV 89101
East Las Vegas NeighborhoodEstimated Value: $292,000 - $397,000
4
Beds
1
Bath
1,299
Sq Ft
$260/Sq Ft
Est. Value
About This Home
This home is located at 868 N 29th St, Las Vegas, NV 89101 and is currently estimated at $337,731, approximately $259 per square foot. 868 N 29th St is a home located in Clark County with nearby schools including Arturo Cambeiro Elementary School, J.D. Smith Middle School, and Desert Pines High School.
Ownership History
Date
Name
Owned For
Owner Type
Purchase Details
Closed on
Jul 16, 2012
Sold by
Sanchez Gustavo and De Sanchez Ramona Belloso
Bought by
Belloso Angel Omar Sanchez
Current Estimated Value
Purchase Details
Closed on
Jul 7, 2010
Sold by
Zhang Jie and Lin Ke
Bought by
Sanchez Gustavo and Sanchez Ramona Belloso
Home Financials for this Owner
Home Financials are based on the most recent Mortgage that was taken out on this home.
Original Mortgage
$57,229
Outstanding Balance
$39,244
Interest Rate
5.37%
Mortgage Type
FHA
Estimated Equity
$298,487
Purchase Details
Closed on
Jun 16, 2010
Sold by
Lin Ke and Zheng Jie
Bought by
Zheng Jie
Home Financials for this Owner
Home Financials are based on the most recent Mortgage that was taken out on this home.
Original Mortgage
$57,229
Outstanding Balance
$39,244
Interest Rate
5.37%
Mortgage Type
FHA
Estimated Equity
$298,487
Purchase Details
Closed on
Feb 2, 2010
Sold by
Rosequist Phil R
Bought by
Zhang Jie and Lin Ke
Purchase Details
Closed on
Dec 15, 2006
Sold by
Rosequist Phil R
Bought by
Sir Jeff Lp
Purchase Details
Closed on
May 26, 2006
Sold by
Rosequist Phil R
Bought by
Rosequist Phil Robert
Home Financials for this Owner
Home Financials are based on the most recent Mortgage that was taken out on this home.
Original Mortgage
$46,957
Interest Rate
6.52%
Mortgage Type
New Conventional
Purchase Details
Closed on
Feb 22, 2005
Sold by
Rosequist Phil R
Bought by
Sir Jeff Lp
Purchase Details
Closed on
Dec 3, 2004
Sold by
Rosequist Phil R
Bought by
Rosequist Phil R
Purchase Details
Closed on
Nov 7, 2002
Sold by
Rosequist Phil Robert
Bought by
Sir Jeff Ltd Partnership
Purchase Details
Closed on
Apr 24, 2002
Sold by
Rosequist Phil R
Bought by
Rosequist Phil Robert
Purchase Details
Closed on
Mar 11, 2002
Sold by
Rosequist Judy A
Bought by
Rosequist Phil R
Purchase Details
Closed on
May 18, 2001
Sold by
Sir Jeff Ltd Partnership
Bought by
Rosequist Judy A
Purchase Details
Closed on
Feb 16, 1999
Sold by
Rosequist Phil R and Rosequist Judy A
Bought by
Sir Jeff Ltd Partnership
Home Financials for this Owner
Home Financials are based on the most recent Mortgage that was taken out on this home.
Original Mortgage
$22,006
Interest Rate
6.77%
Purchase Details
Closed on
Jan 30, 1995
Sold by
Rosequist Phil R and Rosequist Judy A
Bought by
Sir Jeff Ltd Partnership
Create a Home Valuation Report for This Property
The Home Valuation Report is an in-depth analysis detailing your home's value as well as a comparison with similar homes in the area
Home Values in the Area
Average Home Value in this Area
Purchase History
| Date | Buyer | Sale Price | Title Company |
|---|---|---|---|
| Belloso Angel Omar Sanchez | -- | None Available | |
| Sanchez Gustavo | $60,000 | National Title Company | |
| Zheng Jie | -- | None Available | |
| Zhang Jie | $40,100 | None Available | |
| Sir Jeff Lp | -- | None Available | |
| Rosequist Phil R | -- | None Available | |
| Rosequist Phil Robert | -- | Chicago Title | |
| Rosequist Phil R | -- | Chicago Title | |
| Sir Jeff Lp | -- | -- | |
| Rosequist Phil R | -- | -- | |
| Rosequist Phil R | -- | -- | |
| Rosequist Phil R | -- | -- | |
| Sir Jeff Ltd Partnership | -- | Land Title | |
| Rosequist Phil Robert | -- | Land Title | |
| Rosequist Phil Robert | -- | Land Title | |
| Rosequist Phil R | -- | -- | |
| Rosequist Judy A | $67,145 | -- | |
| Sir Jeff Ltd Partnership | -- | Land Title | |
| Rosequist Phil R | $2,000 | Land Title | |
| Sir Jeff Ltd Partnership | -- | -- |
Source: Public Records
Mortgage History
| Date | Status | Borrower | Loan Amount |
|---|---|---|---|
| Open | Sanchez Gustavo | $57,229 | |
| Previous Owner | Rosequist Phil Robert | $46,957 | |
| Previous Owner | Rosequist Phil R | $22,006 |
Source: Public Records
Tax History Compared to Growth
Tax History
| Year | Tax Paid | Tax Assessment Tax Assessment Total Assessment is a certain percentage of the fair market value that is determined by local assessors to be the total taxable value of land and additions on the property. | Land | Improvement |
|---|---|---|---|---|
| 2025 | $732 | $41,878 | $25,900 | $15,978 |
| 2024 | $846 | $41,878 | $25,900 | $15,978 |
| 2023 | $451 | $41,659 | $27,300 | $14,359 |
| 2022 | $628 | $36,326 | $23,450 | $12,876 |
| 2021 | $582 | $29,437 | $17,500 | $11,937 |
| 2020 | $538 | $27,372 | $15,750 | $11,622 |
| 2019 | $504 | $26,265 | $15,050 | $11,215 |
| 2018 | $481 | $23,447 | $12,950 | $10,497 |
| 2017 | $731 | $22,297 | $11,900 | $10,397 |
| 2016 | $451 | $18,123 | $8,050 | $10,073 |
| 2015 | $449 | $15,367 | $5,600 | $9,767 |
| 2014 | $435 | $13,869 | $4,200 | $9,669 |
Source: Public Records
Map
Nearby Homes
- 2932 Theresa Ave
- 2932 Demetrius Ave
- 1304 Melissa St
- 2624 Brady Ave Unit 1
- 1413 N Mojave Rd
- 3204 Osage Ave
- 0 Mcknight St
- 1226 Coach Ln
- 1203 Mews Ln
- 3212 Osage Ave
- 2600 E Bonanza Rd
- 3205 Mary Ann Ave
- 2317 Kirk Ave Unit 4
- 3320 Osage Ave
- 921 Delta St
- 2746 E Owens Ave
- 3200 E Owens Ave
- 520 N 28th St
- 833 Hedge Way Unit 2
- 1025 Dumbarton St
- 872 N 29th St
- 864 N 29th St
- 860 N 29th St
- 2863 E Washington Ave
- 2861 Constantine Ave
- 873 N 29th St
- 856 N 29th St
- 877 N 29th St Unit 2
- 861 N 29th St
- 868 Grand Cir
- 852 N 29th St
- 2856 Constantine Ave
- 864 Grand Cir
- 853 N 29th St
- 2852 Constantine Ave
- 872 Grand Cir
- 2932 Brady Ave
- 2928 Brady Ave
- 2857 Willoughby Ave