868 Poling Dr Columbus, OH 43224
Maize-Morse NeighborhoodEstimated Value: $315,000 - $404,000
3
Beds
1
Bath
1,953
Sq Ft
$190/Sq Ft
Est. Value
About This Home
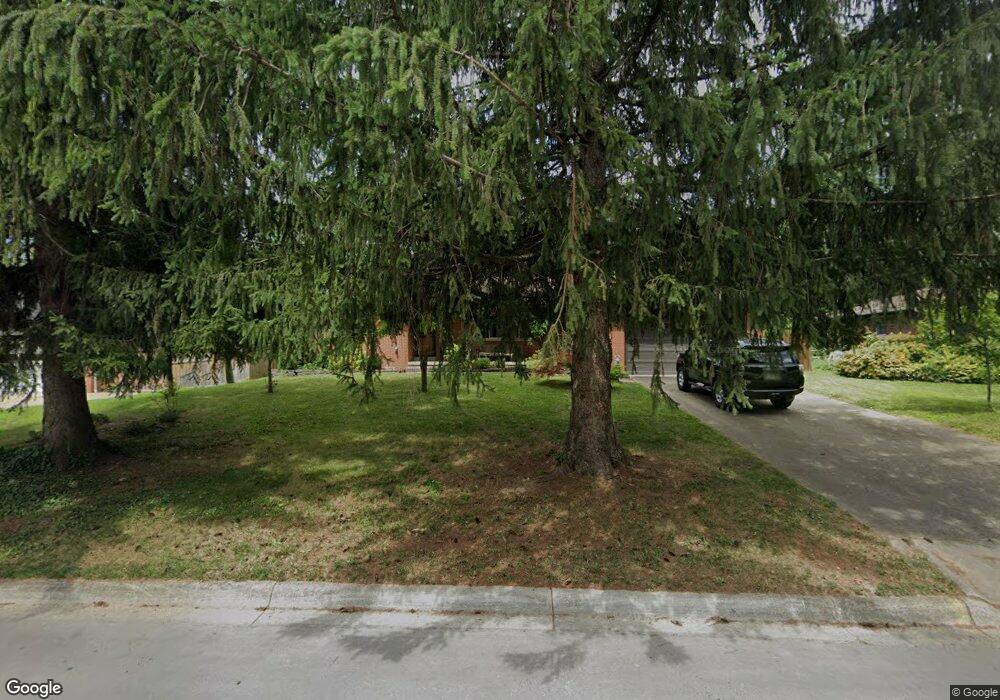
This home is located at 868 Poling Dr, Columbus, OH 43224 and is currently estimated at $371,092, approximately $190 per square foot. 868 Poling Dr is a home located in Franklin County with nearby schools including Maize Road Elementary School, Medina Middle School, and Mifflin High School.
Ownership History
Date
Name
Owned For
Owner Type
Purchase Details
Closed on
Nov 12, 2020
Sold by
Clever Elsa B and Clever Jason T
Bought by
Clever Elsa B
Current Estimated Value
Home Financials for this Owner
Home Financials are based on the most recent Mortgage that was taken out on this home.
Original Mortgage
$111,330
Outstanding Balance
$77,892
Interest Rate
2.67%
Mortgage Type
New Conventional
Estimated Equity
$293,200
Purchase Details
Closed on
Apr 25, 2016
Sold by
Celio Elisa B and Clever Elisa B
Bought by
Clever Elisa B and Clever Jason T
Home Financials for this Owner
Home Financials are based on the most recent Mortgage that was taken out on this home.
Original Mortgage
$132,800
Interest Rate
3.71%
Mortgage Type
New Conventional
Purchase Details
Closed on
Aug 12, 2009
Sold by
Karam Anne M
Bought by
Celio Elisa B
Home Financials for this Owner
Home Financials are based on the most recent Mortgage that was taken out on this home.
Original Mortgage
$147,283
Interest Rate
5.36%
Mortgage Type
FHA
Purchase Details
Closed on
Jul 25, 1989
Bought by
Karam Anne M
Create a Home Valuation Report for This Property
The Home Valuation Report is an in-depth analysis detailing your home's value as well as a comparison with similar homes in the area
Home Values in the Area
Average Home Value in this Area
Purchase History
| Date | Buyer | Sale Price | Title Company |
|---|---|---|---|
| Clever Elsa B | -- | Landsel Title Agency Inc | |
| Clever Elisa B | -- | None Available | |
| Celio Elisa B | -- | Attorney | |
| Karam Anne M | -- | -- |
Source: Public Records
Mortgage History
| Date | Status | Borrower | Loan Amount |
|---|---|---|---|
| Open | Clever Elsa B | $111,330 | |
| Closed | Clever Elisa B | $132,800 | |
| Closed | Celio Elisa B | $147,283 |
Source: Public Records
Tax History
| Year | Tax Paid | Tax Assessment Tax Assessment Total Assessment is a certain percentage of the fair market value that is determined by local assessors to be the total taxable value of land and additions on the property. | Land | Improvement |
|---|---|---|---|---|
| 2025 | $4,758 | $106,020 | $25,100 | $80,920 |
| 2024 | $4,758 | $106,020 | $25,100 | $80,920 |
| 2023 | $4,697 | $106,015 | $25,095 | $80,920 |
| 2022 | $3,972 | $76,580 | $13,650 | $62,930 |
| 2021 | $3,979 | $76,580 | $13,650 | $62,930 |
| 2020 | $3,984 | $76,580 | $13,650 | $62,930 |
| 2019 | $3,731 | $61,500 | $10,920 | $50,580 |
| 2018 | $3,241 | $61,500 | $10,920 | $50,580 |
| 2017 | $3,729 | $61,500 | $10,920 | $50,580 |
| 2016 | $3,040 | $45,890 | $10,330 | $35,560 |
| 2015 | $2,760 | $45,890 | $10,330 | $35,560 |
| 2014 | $2,766 | $45,890 | $10,330 | $35,560 |
| 2013 | $1,436 | $48,300 | $10,885 | $37,415 |
Source: Public Records
Map
Nearby Homes
- 899 Meadowview Dr
- 827 Inwood Place
- 1130 Carbone Dr
- 4605 Glenmawr Ave
- 991 Hidden Acres Ct Unit 991
- 1144 Reed Circle Dr
- 390 Lenappe Dr
- 435 E Beaumont Rd
- 440 Chatham Rd
- 601 Morse Rd
- 3941 Karl Rd Unit 326
- 389 Wetmore Rd
- 3967 Karl Rd Unit 224
- 3939 Karl Rd Unit 311
- 4143 Karl Rd Unit 215
- 4143 Karl Rd Unit 314
- 4145 Karl Rd Unit 223
- 3546 Beulah Rd
- 374 Acton Rd
- 243 E Schreyer Place
- 870 Poling Dr
- 832 Marland Dr S
- 866 Poling Dr
- 820 Marland Dr S
- 4206 Glenmawr Ave
- 4218 Glenmawr Ave
- 869 Poling Dr
- 873 Poling Dr
- 877 Poling Dr
- 4194 Glenmawr Ave
- 4226 Glenmawr Ave
- 876 Poling Dr
- 876 Marland Dr S
- 881 Poling Dr
- 819 Marland Dr S
- 831 Meadowview Dr
- 855 Marland Dr S
- 819 Meadowview Dr
- 833 Marland Dr S
- 880 Poling Dr
Your Personal Tour Guide
Ask me questions while you tour the home.