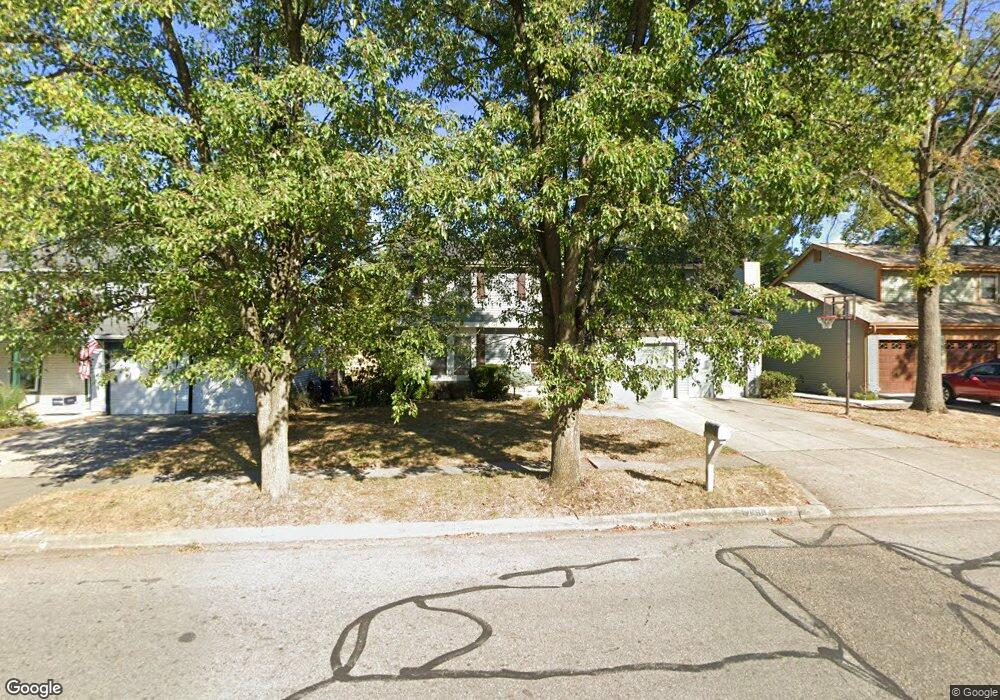
868 Ridenour Rd Columbus, OH 43230
Woodside Green NeighborhoodEstimated Value: $410,988 - $420,000
4
Beds
4
Baths
1,976
Sq Ft
$211/Sq Ft
Est. Value
About This Home
This home is located at 868 Ridenour Rd, Columbus, OH 43230 and is currently estimated at $416,747, approximately $210 per square foot. 868 Ridenour Rd is a home located in Franklin County with nearby schools including Chapelfield Elementary School, Gahanna West Middle School, and Lincoln High School.
Ownership History
Date
Name
Owned For
Owner Type
Purchase Details
Closed on
Aug 29, 2011
Sold by
Kelley Richard W and Kelley Patti J
Bought by
Epneris Jeremy M and Epneris Katherine D
Current Estimated Value
Home Financials for this Owner
Home Financials are based on the most recent Mortgage that was taken out on this home.
Original Mortgage
$169,100
Outstanding Balance
$116,570
Interest Rate
4.4%
Mortgage Type
Purchase Money Mortgage
Estimated Equity
$300,177
Purchase Details
Closed on
Apr 25, 2008
Sold by
Palombaro Damien G and Palombaro Erica N
Bought by
Campanelli Leonard J and Campanelli Heather A
Home Financials for this Owner
Home Financials are based on the most recent Mortgage that was taken out on this home.
Original Mortgage
$194,085
Interest Rate
5.88%
Mortgage Type
VA
Purchase Details
Closed on
Mar 19, 1999
Sold by
Pinckney Robert L and Pinckney Sharon D
Bought by
Palombaro Damien G and Palombaro Erica N
Home Financials for this Owner
Home Financials are based on the most recent Mortgage that was taken out on this home.
Original Mortgage
$124,796
Interest Rate
6.8%
Mortgage Type
FHA
Purchase Details
Closed on
Oct 7, 1988
Bought by
Pinckney Robert L
Purchase Details
Closed on
Sep 6, 1988
Create a Home Valuation Report for This Property
The Home Valuation Report is an in-depth analysis detailing your home's value as well as a comparison with similar homes in the area
Home Values in the Area
Average Home Value in this Area
Purchase History
| Date | Buyer | Sale Price | Title Company |
|---|---|---|---|
| Epneris Jeremy M | $178,000 | Hummel Titl | |
| Campanelli Leonard J | $190,000 | Chicago Tit | |
| Palombaro Damien G | $124,900 | -- | |
| Pinckney Robert L | -- | -- | |
| -- | $78,500 | -- |
Source: Public Records
Mortgage History
| Date | Status | Borrower | Loan Amount |
|---|---|---|---|
| Open | Epneris Jeremy M | $169,100 | |
| Closed | Campanelli Leonard J | $194,085 | |
| Closed | Palombaro Damien G | $124,796 |
Source: Public Records
Tax History Compared to Growth
Tax History
| Year | Tax Paid | Tax Assessment Tax Assessment Total Assessment is a certain percentage of the fair market value that is determined by local assessors to be the total taxable value of land and additions on the property. | Land | Improvement |
|---|---|---|---|---|
| 2024 | $6,779 | $115,080 | $26,250 | $88,830 |
| 2023 | $6,694 | $115,080 | $26,250 | $88,830 |
| 2022 | $6,221 | $83,310 | $12,850 | $70,460 |
| 2021 | $6,017 | $83,310 | $12,850 | $70,460 |
| 2020 | $5,967 | $83,310 | $12,850 | $70,460 |
| 2019 | $4,979 | $69,370 | $10,710 | $58,660 |
| 2018 | $4,675 | $69,370 | $10,710 | $58,660 |
| 2017 | $4,486 | $69,370 | $10,710 | $58,660 |
| 2016 | $4,403 | $60,870 | $12,990 | $47,880 |
| 2015 | $4,406 | $60,870 | $12,990 | $47,880 |
| 2014 | $4,372 | $60,870 | $12,990 | $47,880 |
| 2013 | $2,171 | $60,865 | $12,985 | $47,880 |
Source: Public Records
Map
Nearby Homes
- 111 Nob Hill Dr N
- 642 Ridenour Rd
- 108 Walcreek Dr W
- 402 Bluestem Ave
- 459 Bluestem Ave
- 536 Springwood Lake Dr
- 3544 Halpern St
- 0 Wendler Blvd
- 638 Thistle Ave
- 211 Crossing Creek N
- 200 Glenhurst Ct
- 167 Greenbank Rd
- 3555 Tami Place
- 3877 Hines Rd
- 3150 Berkley Pointe Dr
- 3118 Berkley Pointe Dr
- 158 Windrow Ct
- 302 Zander Ln Unit 302
- 388 Elkwood Place
- 365 Sycamore Woods Ln Unit 365
- 874 Ridenour Rd
- 862 Ridenour Rd
- 880 Ridenour Rd
- 244 Benton Way
- 240 Benton Way
- 856 Ridenour Rd
- 244 Sumption Dr
- 861 Ridenour Rd
- 886 Ridenour Rd
- 248 Sumption Dr
- 879 Ridenour Rd
- 232 Benton Way
- 853 Ridenour Rd
- 252 Sumption Dr
- 250 Benton Way
- 271 Rimbey Ave
- 892 Ridenour Rd
- 845 Mcdonell Dr
- 256 Sumption Dr
- 226 Benton Way