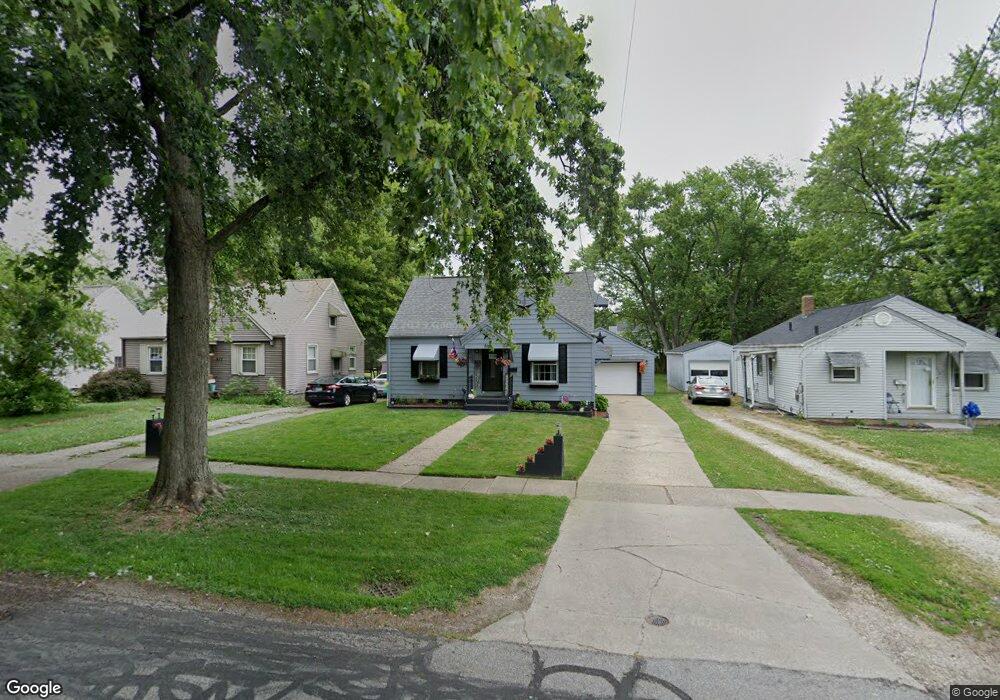
868 W Riddle Ave Ravenna, OH 44266
Estimated Value: $140,000 - $167,000
3
Beds
1
Bath
1,188
Sq Ft
$130/Sq Ft
Est. Value
About This Home
This home is located at 868 W Riddle Ave, Ravenna, OH 44266 and is currently estimated at $155,027, approximately $130 per square foot. 868 W Riddle Ave is a home located in Portage County with nearby schools including West Main Elementary School, West Park Elementary School, and Brown Middle School.
Ownership History
Date
Name
Owned For
Owner Type
Purchase Details
Closed on
Dec 7, 2015
Sold by
Schamaker Melissa and Snode Melissa
Bought by
Marsh Jessica L
Current Estimated Value
Home Financials for this Owner
Home Financials are based on the most recent Mortgage that was taken out on this home.
Original Mortgage
$81,496
Outstanding Balance
$65,770
Interest Rate
4.5%
Mortgage Type
FHA
Estimated Equity
$89,257
Purchase Details
Closed on
Apr 8, 2010
Sold by
Spagnuolo Philip and Spagnuolo Sara
Bought by
Snode Melissa
Purchase Details
Closed on
Jan 1, 1990
Bought by
Spagnuolo Dino L
Create a Home Valuation Report for This Property
The Home Valuation Report is an in-depth analysis detailing your home's value as well as a comparison with similar homes in the area
Home Values in the Area
Average Home Value in this Area
Purchase History
| Date | Buyer | Sale Price | Title Company |
|---|---|---|---|
| Marsh Jessica L | $83,150 | Diamond Title Co | |
| Snode Melissa | $82,500 | Attorney | |
| Spagnuolo Dino L | -- | -- |
Source: Public Records
Mortgage History
| Date | Status | Borrower | Loan Amount |
|---|---|---|---|
| Open | Marsh Jessica L | $81,496 |
Source: Public Records
Tax History Compared to Growth
Tax History
| Year | Tax Paid | Tax Assessment Tax Assessment Total Assessment is a certain percentage of the fair market value that is determined by local assessors to be the total taxable value of land and additions on the property. | Land | Improvement |
|---|---|---|---|---|
| 2024 | $1,563 | $42,850 | $5,360 | $37,490 |
| 2023 | $1,512 | $33,960 | $5,360 | $28,600 |
| 2022 | $1,512 | $33,960 | $5,360 | $28,600 |
| 2021 | $1,514 | $33,960 | $5,360 | $28,600 |
| 2020 | $1,446 | $28,810 | $5,360 | $23,450 |
| 2019 | $1,448 | $28,810 | $5,360 | $23,450 |
| 2018 | $1,448 | $27,240 | $6,830 | $20,410 |
| 2017 | $1,448 | $27,240 | $6,830 | $20,410 |
| 2016 | $1,361 | $27,240 | $6,830 | $20,410 |
| 2015 | $1,363 | $27,240 | $6,830 | $20,410 |
| 2014 | $1,361 | $27,240 | $6,830 | $20,410 |
| 2013 | $1,352 | $27,240 | $6,830 | $20,410 |
Source: Public Records
Map
Nearby Homes
- 1024 W Riddle Ave
- 856 W Main St
- 110 Oakwood St
- 1057 W Riddle Ave
- 825 W Highland Ave
- 208 King St
- 247 King St
- 656 W Highland Ave
- 452 Mill Rd
- 646 3rd St
- 3505 Ohio 59 Unit 105
- 3505 Ohio 59 Unit 166
- 3505 Ohio 59 Unit 46
- 6287 Cara Dr
- 1006 Brittingham Dr
- 668 Westbrook Ct
- 1056 Sunnywood Ln
- 3366 Hommon Rd
- 159 E Harris Ave
- 3229 Brady Lake Rd
- 872 W Riddle Ave
- 864 W Riddle Ave
- 876 W Riddle Ave
- 270 Madison St
- 879 W Riddle Ave
- 266 Madison St
- 264 Madison St
- 880 W Riddle Ave
- 882 W Riddle Ave
- 260 Madison St
- 402 Madison St
- 248 Madison St
- 406 Madison St
- 883 W Riddle Ave
- 886 W Riddle Ave
- 871 W Spruce Ave
- 873 W Spruce Ave
- 869 W Spruce Ave
- 870 Conant Ct
- 247 Maplewood St