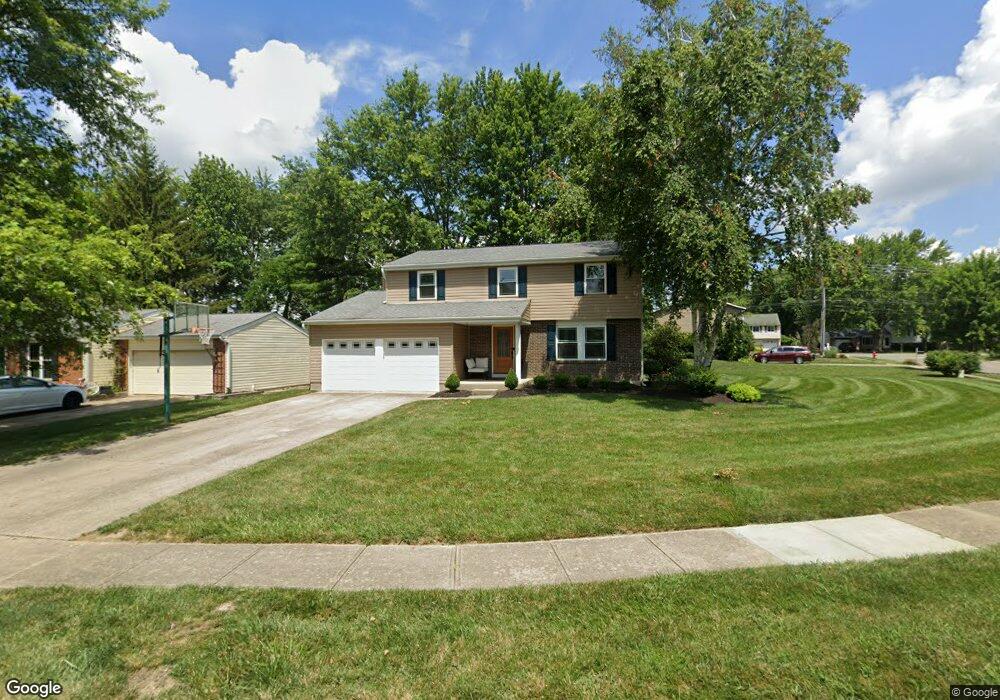
8683 Meadow Dr Mason, OH 45040
Landen NeighborhoodEstimated Value: $371,515 - $393,000
4
Beds
3
Baths
1,902
Sq Ft
$200/Sq Ft
Est. Value
About This Home
This home is located at 8683 Meadow Dr, Mason, OH 45040 and is currently estimated at $379,879, approximately $199 per square foot. 8683 Meadow Dr is a home located in Warren County with nearby schools including Kings Junior High School, Kings High School, and King Of Kings Lutheran Early Childhood Education.
Ownership History
Date
Name
Owned For
Owner Type
Purchase Details
Closed on
May 3, 2001
Sold by
Rhodes Scott
Bought by
Fails Robert E
Current Estimated Value
Purchase Details
Closed on
May 9, 1995
Sold by
Cooper Gary J
Bought by
Rhodes Scott C and Rhodes Sharon C
Home Financials for this Owner
Home Financials are based on the most recent Mortgage that was taken out on this home.
Original Mortgage
$170,800
Interest Rate
8.5%
Mortgage Type
New Conventional
Purchase Details
Closed on
Apr 8, 1985
Sold by
Gateway Federal Savings
Bought by
Cooper Cooper and Cooper Gary J
Purchase Details
Closed on
Jul 20, 1984
Sold by
Dane Wright and Dane S.
Bought by
Gateway Federal Savings
Purchase Details
Closed on
Sep 4, 1979
Sold by
Ryland Goup & Inc
Purchase Details
Closed on
Jan 19, 1978
Sold by
Landen Farm Co
Create a Home Valuation Report for This Property
The Home Valuation Report is an in-depth analysis detailing your home's value as well as a comparison with similar homes in the area
Home Values in the Area
Average Home Value in this Area
Purchase History
| Date | Buyer | Sale Price | Title Company |
|---|---|---|---|
| Fails Robert E | $147,000 | -- | |
| Rhodes Scott C | $118,500 | -- | |
| Cooper Cooper | $72,900 | -- | |
| Gateway Federal Savings | $70,000 | -- | |
| -- | $71,500 | -- | |
| -- | -- | -- |
Source: Public Records
Mortgage History
| Date | Status | Borrower | Loan Amount |
|---|---|---|---|
| Previous Owner | Rhodes Scott C | $170,800 | |
| Closed | Fails Robert E | -- |
Source: Public Records
Tax History
| Year | Tax Paid | Tax Assessment Tax Assessment Total Assessment is a certain percentage of the fair market value that is determined by local assessors to be the total taxable value of land and additions on the property. | Land | Improvement |
|---|---|---|---|---|
| 2025 | $5,135 | $98,430 | $24,500 | $73,930 |
| 2024 | $5,135 | $98,430 | $24,500 | $73,930 |
| 2023 | $4,552 | $78,372 | $12,915 | $65,457 |
| 2022 | $4,469 | $78,372 | $12,915 | $65,457 |
| 2021 | $3,744 | $78,372 | $12,915 | $65,457 |
| 2020 | $3,618 | $63,718 | $10,500 | $53,218 |
| 2019 | $3,662 | $63,718 | $10,500 | $53,218 |
| 2018 | $3,642 | $63,718 | $10,500 | $53,218 |
| 2017 | $3,812 | $59,035 | $10,371 | $48,664 |
| 2016 | $3,909 | $59,035 | $10,371 | $48,664 |
| 2015 | $3,528 | $59,035 | $10,371 | $48,664 |
| 2014 | $3,322 | $52,240 | $9,180 | $43,060 |
| 2013 | $3,327 | $59,770 | $10,500 | $49,270 |
Source: Public Records
Map
Nearby Homes
- 3833 Spring Mill Way
- 3761 Green Haven Way
- 8839 Pollard Place
- 9204 Yarmouth Dr Unit 9204
- 9547 Carriage Run Cir
- 3154 Vineyard Ct
- 8819 Pembrooke St
- 9626 Greenery Ct
- 4281 S Haven Dr
- 2956 Kingsley Ct
- 3444 Twenty Mile Way Unit 3444
- 4390 S Mallard Cove
- 2898 Mossy Brink Ct Unit 19
- 3492 Twenty Mile Way Unit 3492
- 8846 Morley Place
- 4251 S Shore Dr
- 7838 Carraway Ct
- 2107 Clearwater Ct
- 2113 Clearwater Ct
- 2115 Clearwater Ct
- 8707 Meadow Dr
- 8651 Meadow Dr
- 3901 Irwin Simpson Rd
- 8719 Meadow Dr
- 3911 Irwin Simpson Rd
- 8674 Meadow Dr
- 8700 Meadow Dr
- 8690 Meadow Dr
- 8682 Meadow Dr
- 8664 Meadow Dr
- 8710 Meadow Dr
- 8729 Meadow Dr
- 3925 Irwin Simpson Rd
- 8650 Meadow Dr
- 8724 Meadow Dr
- 3935 Irwin Simpson Rd
- 8663 Simpson Ct
- 8739 Meadow Dr
- 3843 Irwin Simpson Rd
- 3894 Irwin Simpson Rd
Your Personal Tour Guide
Ask me questions while you tour the home.