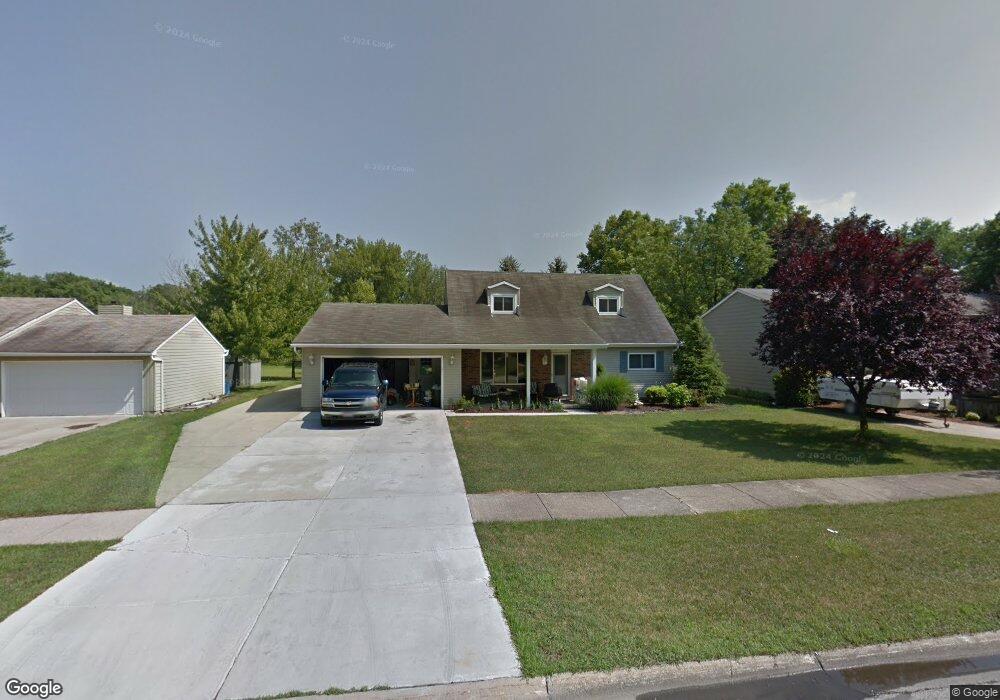
8687 Fairlane Dr Olmsted Falls, OH 44138
Estimated Value: $293,123 - $319,000
4
Beds
2
Baths
1,764
Sq Ft
$171/Sq Ft
Est. Value
About This Home
This home is located at 8687 Fairlane Dr, Olmsted Falls, OH 44138 and is currently estimated at $302,031, approximately $171 per square foot. 8687 Fairlane Dr is a home located in Cuyahoga County with nearby schools including Falls-Lenox Primary Elementary School, Olmsted Falls Intermediate Building, and Olmsted Falls Middle School.
Ownership History
Date
Name
Owned For
Owner Type
Purchase Details
Closed on
Apr 16, 2014
Sold by
Potter James F and Potter Sharon A
Bought by
Potter James F and Potter Sharon A
Current Estimated Value
Home Financials for this Owner
Home Financials are based on the most recent Mortgage that was taken out on this home.
Original Mortgage
$133,976
Outstanding Balance
$71,755
Interest Rate
4.33%
Mortgage Type
New Conventional
Estimated Equity
$230,276
Purchase Details
Closed on
Jun 20, 2006
Sold by
Andrews Thomas P and Andrews Michelle
Bought by
Potter James F and Kohler Sharon A
Home Financials for this Owner
Home Financials are based on the most recent Mortgage that was taken out on this home.
Original Mortgage
$20,000
Interest Rate
6.68%
Mortgage Type
Stand Alone Second
Purchase Details
Closed on
Aug 16, 1991
Sold by
Justice Wade W
Bought by
Andrews Thomas P
Purchase Details
Closed on
Feb 1, 1977
Bought by
Justice Wade W
Purchase Details
Closed on
Jan 1, 1975
Bought by
G & M Building Co Inc
Create a Home Valuation Report for This Property
The Home Valuation Report is an in-depth analysis detailing your home's value as well as a comparison with similar homes in the area
Home Values in the Area
Average Home Value in this Area
Purchase History
| Date | Buyer | Sale Price | Title Company |
|---|---|---|---|
| Potter James F | -- | Lawyers Title | |
| Potter James F | $185,500 | Barristers Title Agency | |
| Andrews Thomas P | $110,000 | -- | |
| Justice Wade W | $45,500 | -- | |
| G & M Building Co Inc | -- | -- |
Source: Public Records
Mortgage History
| Date | Status | Borrower | Loan Amount |
|---|---|---|---|
| Open | Potter James F | $133,976 | |
| Closed | Potter James F | $20,000 | |
| Closed | Potter James F | $146,900 |
Source: Public Records
Tax History Compared to Growth
Tax History
| Year | Tax Paid | Tax Assessment Tax Assessment Total Assessment is a certain percentage of the fair market value that is determined by local assessors to be the total taxable value of land and additions on the property. | Land | Improvement |
|---|---|---|---|---|
| 2024 | $6,615 | $87,500 | $15,540 | $71,960 |
| 2023 | $6,125 | $65,740 | $13,410 | $52,330 |
| 2022 | $6,080 | $65,730 | $13,410 | $52,330 |
| 2021 | $6,024 | $65,730 | $13,410 | $52,330 |
| 2020 | $5,722 | $55,230 | $11,270 | $43,960 |
| 2019 | $5,194 | $157,800 | $32,200 | $125,600 |
| 2018 | $4,873 | $55,230 | $11,270 | $43,960 |
| 2017 | $4,779 | $48,930 | $10,430 | $38,500 |
| 2016 | $4,756 | $48,930 | $10,430 | $38,500 |
| 2015 | $4,719 | $48,930 | $10,430 | $38,500 |
| 2014 | $4,719 | $47,500 | $10,120 | $37,380 |
Source: Public Records
Map
Nearby Homes
- 26788 Skyline Dr
- V/L Usher Rd
- 25950 Bagley Rd
- 29 Carl Ln
- 26508 Redwood Dr
- Anderson Plan at Smokestack Trails
- Bramante Ranch Plan at Smokestack Trails
- Hudson Plan at Smokestack Trails
- Columbia Plan at Smokestack Trails
- Lehigh Plan at Smokestack Trails
- 26700 Redwood Dr
- 26511 Locust Dr
- Caroline Plan at Falls Landing - Villas
- Wexford Plan at Falls Landing - Villas
- Rosecliff Plan at Falls Landing - Villas
- 0
- 9159 E Windsor Dr
- 26179 Raintree Blvd Unit D8
- 26187 Raintree Blvd Unit C5
- 26183 Raintree Blvd Unit C-10
- 8695 Fairlane Dr
- 8663 Fairlane Dr
- 8703 Fairlane Dr
- 8562 Usher Rd
- 8560 Usher Rd
- 8564 Usher Rd
- 8680 Fairlane Dr
- 8711 Fairlane Dr
- 8647 Fairlane Dr
- 8558 Usher Rd
- 8566 Usher Rd
- 8692 Fairlane Dr
- 8556 Usher Rd
- 8719 Fairlane Dr
- 8568 Usher Rd
- 26399 Kingswood Dr
- 26455 Kingswood Dr
- 26377 Kingswood Dr
- 8700 Fairlane Dr
- 8708 Fairlane Dr