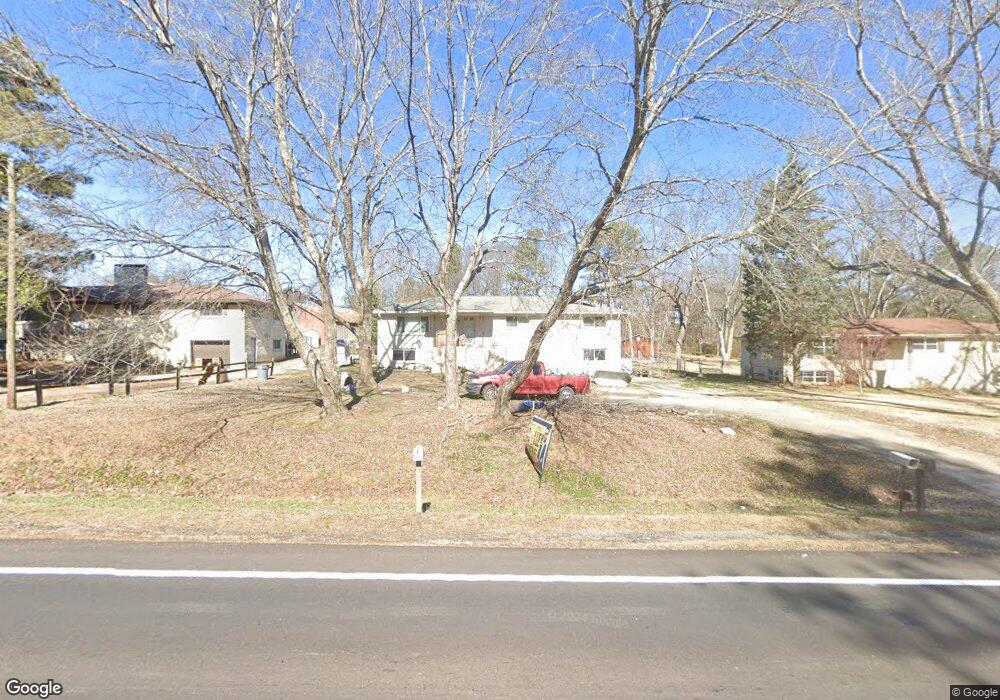
8688 E Highway 78 Villa Rica, GA 30180
Winston NeighborhoodEstimated Value: $209,000 - $239,675
3
Beds
2
Baths
1,425
Sq Ft
$158/Sq Ft
Est. Value
About This Home
This home is located at 8688 E Highway 78, Villa Rica, GA 30180 and is currently estimated at $225,669, approximately $158 per square foot. 8688 E Highway 78 is a home located in Douglas County with nearby schools including Mirror Lake Elementary School, Mason Creek Middle School, and Douglas County High School.
Ownership History
Date
Name
Owned For
Owner Type
Purchase Details
Closed on
May 2, 2024
Sold by
Harbuck Shirley Ann
Bought by
Harbuck Shirley Ann and Hantando Aletha J
Current Estimated Value
Purchase Details
Closed on
Jun 26, 2017
Sold by
Harbuck Philip Morris
Bought by
Harbuck Philip Morris and Harbuck Shirley Ann
Home Financials for this Owner
Home Financials are based on the most recent Mortgage that was taken out on this home.
Original Mortgage
$95,950
Interest Rate
4.1%
Mortgage Type
VA
Purchase Details
Closed on
May 2, 2017
Sold by
Harbuck Philip Morris
Bought by
Harbuck Philip Morris and Hantando Aletha J
Home Financials for this Owner
Home Financials are based on the most recent Mortgage that was taken out on this home.
Original Mortgage
$95,950
Interest Rate
4.1%
Mortgage Type
VA
Purchase Details
Closed on
Apr 19, 2001
Sold by
Malfitany Joseph F and Malfitany Florence A
Bought by
Malfitany Trust
Create a Home Valuation Report for This Property
The Home Valuation Report is an in-depth analysis detailing your home's value as well as a comparison with similar homes in the area
Home Values in the Area
Average Home Value in this Area
Purchase History
| Date | Buyer | Sale Price | Title Company |
|---|---|---|---|
| Harbuck Shirley Ann | -- | None Listed On Document | |
| Harbuck Shirley Ann | -- | None Listed On Document | |
| Harbuck Philip Morris | -- | -- | |
| Harbuck Philip Morris | -- | -- | |
| Malfitany Trust | -- | -- |
Source: Public Records
Mortgage History
| Date | Status | Borrower | Loan Amount |
|---|---|---|---|
| Previous Owner | Harbuck Philip Morris | $95,950 |
Source: Public Records
Tax History Compared to Growth
Tax History
| Year | Tax Paid | Tax Assessment Tax Assessment Total Assessment is a certain percentage of the fair market value that is determined by local assessors to be the total taxable value of land and additions on the property. | Land | Improvement |
|---|---|---|---|---|
| 2024 | $2,532 | $80,480 | $16,400 | $64,080 |
| 2023 | $2,532 | $52,880 | $8,000 | $44,880 |
| 2022 | $1,722 | $52,880 | $8,000 | $44,880 |
| 2021 | $1,253 | $43,440 | $8,000 | $35,440 |
| 2020 | $1,277 | $43,440 | $8,000 | $35,440 |
| 2019 | $1,186 | $42,560 | $8,000 | $34,560 |
| 2018 | $1,162 | $41,120 | $8,000 | $33,120 |
| 2017 | $1,077 | $37,240 | $8,000 | $29,240 |
| 2016 | $1,051 | $35,880 | $8,000 | $27,880 |
| 2015 | $997 | $34,960 | $8,000 | $26,960 |
| 2014 | $997 | $33,040 | $8,000 | $25,040 |
| 2013 | -- | $33,040 | $8,000 | $25,040 |
Source: Public Records
Map
Nearby Homes
- 14300 Veterans Memorial Hwy
- 14301 Veterans Memorial Hwy
- 0 N Mckoy Rd Unit 7546450
- 8851 Conners Rd
- 435 Prescott Way
- 491 Prescott Way
- 497 Prescott Way
- 481 Prescott Way
- 479 Prescott Way
- 483 Prescott Way
- 487 Prescott Way
- 493 Prescott Way
- 478 Prescott Way
- 471 Prescott Way
- 470 Prescott Way
- 489 Prescott Way
- 495 Prescott Way
- 473 Prescott Way
- 477 Prescott Way
- 482 Prescott Way
- 8678 E Highway 78
- 8698 E Highway 78
- 8668 E Highway 78
- 8708 E Highway 78
- 8629 Andy Mountain Rd
- 8658 E Highway 78
- 8629 Andy Mountain Rd
- 0 Ale Ln
- 14291 Veterans Memorial Hwy
- 14291 Veterans Memorial Hwy
- 8607 Ale Ln
- 8646 E Highway 78
- 8587 Ale Ln
- 8597 Ale Ln
- 0 Andy Mountain Rd Unit 7452039
- 0 Andy Mountain Rd Unit 7452038
- 0 Andy Mountain Rd Unit 7452040
- 0 Andy Mountain Rd Unit 8710612
- 0 Andy Mountain Rd
- 8627 Ale Ln