Estimated Value: $295,256 - $356,000
3
Beds
2
Baths
1,356
Sq Ft
$242/Sq Ft
Est. Value
About This Home
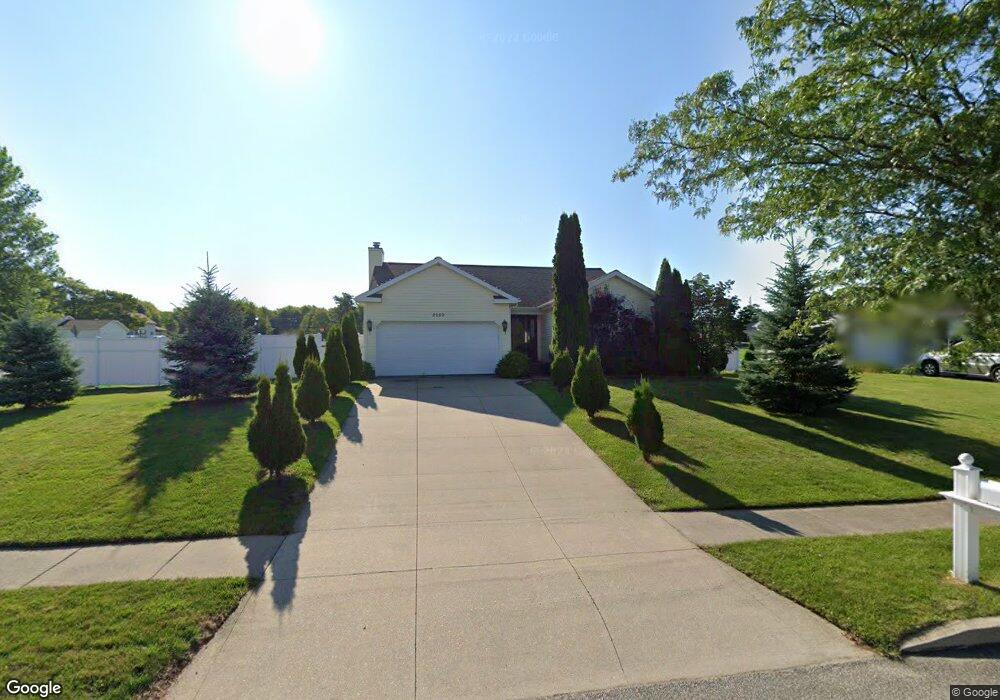
This home is located at 8689 Valley View Cir, Erie, PA 16509 and is currently estimated at $328,814, approximately $242 per square foot. 8689 Valley View Cir is a home located in Erie County with nearby schools including Fort Leboeuf Middle School, Fort Leboeuf Senior High School, and St George Grade School.
Ownership History
Date
Name
Owned For
Owner Type
Purchase Details
Closed on
Oct 23, 2009
Sold by
Sheets Betty L
Bought by
Papeko Sergey S and Papeko Yelena
Current Estimated Value
Home Financials for this Owner
Home Financials are based on the most recent Mortgage that was taken out on this home.
Original Mortgage
$161,900
Outstanding Balance
$115,289
Interest Rate
5.09%
Mortgage Type
Purchase Money Mortgage
Estimated Equity
$213,525
Purchase Details
Closed on
Jul 22, 2005
Sold by
Cunningham Thomas P and Cunningham Gini S
Bought by
Sheets Betty L
Purchase Details
Closed on
Oct 11, 1999
Sold by
Sumprop Investments Inc
Bought by
Struchen Allan L and Struchen Charlene J
Home Financials for this Owner
Home Financials are based on the most recent Mortgage that was taken out on this home.
Original Mortgage
$42,000
Interest Rate
7.81%
Create a Home Valuation Report for This Property
The Home Valuation Report is an in-depth analysis detailing your home's value as well as a comparison with similar homes in the area
Home Values in the Area
Average Home Value in this Area
Purchase History
| Date | Buyer | Sale Price | Title Company |
|---|---|---|---|
| Papeko Sergey S | $161,900 | None Available | |
| Sheets Betty L | $156,900 | -- | |
| Struchen Allan L | $122,000 | -- |
Source: Public Records
Mortgage History
| Date | Status | Borrower | Loan Amount |
|---|---|---|---|
| Open | Papeko Sergey S | $161,900 | |
| Previous Owner | Struchen Allan L | $42,000 |
Source: Public Records
Tax History Compared to Growth
Tax History
| Year | Tax Paid | Tax Assessment Tax Assessment Total Assessment is a certain percentage of the fair market value that is determined by local assessors to be the total taxable value of land and additions on the property. | Land | Improvement |
|---|---|---|---|---|
| 2025 | $3,500 | $159,600 | $36,100 | $123,500 |
| 2024 | $3,358 | $159,600 | $36,100 | $123,500 |
| 2023 | $3,174 | $159,600 | $36,100 | $123,500 |
| 2022 | $3,090 | $159,600 | $36,100 | $123,500 |
| 2021 | $3,016 | $159,600 | $36,100 | $123,500 |
| 2020 | $2,977 | $159,600 | $36,100 | $123,500 |
| 2019 | $2,977 | $159,600 | $36,100 | $123,500 |
| 2018 | $2,929 | $159,600 | $36,100 | $123,500 |
| 2017 | $2,870 | $159,600 | $36,100 | $123,500 |
| 2016 | $3,384 | $159,600 | $36,100 | $123,500 |
| 2015 | $3,344 | $159,600 | $36,100 | $123,500 |
| 2014 | $1,668 | $159,600 | $36,100 | $123,500 |
Source: Public Records
Map
Nearby Homes
- 8724 Robin Dr
- 2880 Cardinal Dr Unit 34
- 8675 Oriole Dr
- 8535 Oliver Rd
- 8720 Oriole Dr
- 0 Flower Rd
- 8340-8350 Oliver Rd
- 8350 Oliver Rd
- 8340 Oliver Rd
- 2814 Dorn Rd
- 2695 Saddlewood Dr Unit 4
- 2635 Saddlewood Dr Unit 19
- 2632 N Shelby Dr
- 0 Pagan Rd
- 8780 Evelyn Way
- 3500 Dunn Valley Rd
- 0 Hawthorne Dr
- 4241 Dunn Valley Rd
- 2933 Hershey Rd
- 8020 Oliver Rd
- 8693 Valley View Cir
- 8699 Valley View Cir
- 8686 Oliver Rd
- 8673 Valley View Cir
- 8688 Valley View Cir
- 8690 Oliver Rd
- 8684 Valley View Cir
- 8692 Valley View Cir
- 8705 Valley View Cir
- 8670 Oliver Rd
- 8680 Valley View Cir
- 8698 Valley View Cir
- 8702 Oliver Rd
- 2770 Cardinal Dr
- 8355 Oliver Rd
- 8704 Valley View Cir
- 8713 Valley View Cir
- 8664 Oliver Rd
- 8710 Oliver Rd
- 2780 Cardinal Dr