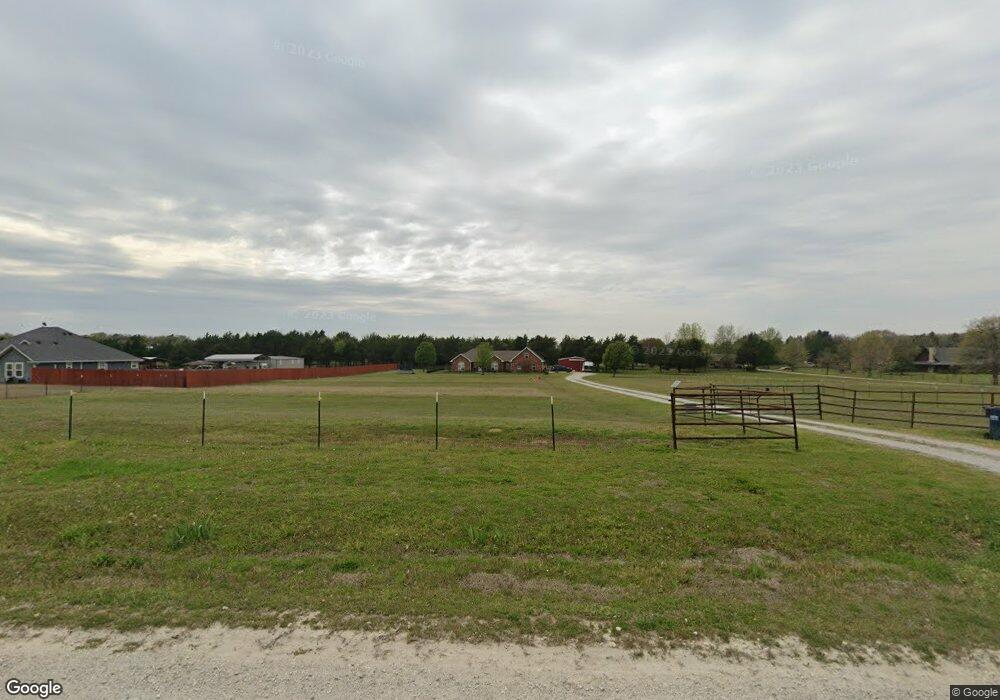
869 County Road 153 Whitesboro, TX 76273
Estimated Value: $458,000 - $584,000
3
Beds
2
Baths
1,678
Sq Ft
$301/Sq Ft
Est. Value
About This Home
This home is located at 869 County Road 153, Whitesboro, TX 76273 and is currently estimated at $505,298, approximately $301 per square foot. 869 County Road 153 is a home located in Cooke County with nearby schools including J.W. Hayes Primary School, Whitesboro Intermediate School, and Whitesboro Middle School.
Ownership History
Date
Name
Owned For
Owner Type
Purchase Details
Closed on
Apr 5, 2019
Sold by
Moran Shannon and Moran Karen
Bought by
West Cynthia L
Current Estimated Value
Home Financials for this Owner
Home Financials are based on the most recent Mortgage that was taken out on this home.
Original Mortgage
$187,000
Outstanding Balance
$163,732
Interest Rate
4.3%
Mortgage Type
New Conventional
Estimated Equity
$341,566
Purchase Details
Closed on
Jun 9, 2017
Sold by
Endler John Alan and Chisolm Jana Lyn
Bought by
Moran Shannon and Moran Karen
Home Financials for this Owner
Home Financials are based on the most recent Mortgage that was taken out on this home.
Original Mortgage
$168,000
Interest Rate
4.03%
Mortgage Type
New Conventional
Purchase Details
Closed on
May 9, 2006
Sold by
Vaughn Wilbur J and Vaughn Barbara Ann
Bought by
Endler John Alan and Chisolm Jana Lyn
Create a Home Valuation Report for This Property
The Home Valuation Report is an in-depth analysis detailing your home's value as well as a comparison with similar homes in the area
Home Values in the Area
Average Home Value in this Area
Purchase History
| Date | Buyer | Sale Price | Title Company |
|---|---|---|---|
| West Cynthia L | -- | None Available | |
| Moran Shannon | -- | None Available | |
| Endler John Alan | -- | -- |
Source: Public Records
Mortgage History
| Date | Status | Borrower | Loan Amount |
|---|---|---|---|
| Open | West Cynthia L | $187,000 | |
| Previous Owner | Moran Shannon | $168,000 |
Source: Public Records
Tax History Compared to Growth
Tax History
| Year | Tax Paid | Tax Assessment Tax Assessment Total Assessment is a certain percentage of the fair market value that is determined by local assessors to be the total taxable value of land and additions on the property. | Land | Improvement |
|---|---|---|---|---|
| 2025 | $1,825 | $408,542 | $145,000 | $278,409 |
| 2024 | $1,825 | $423,409 | $145,000 | $278,409 |
| 2023 | $6,600 | $450,577 | $164,000 | $286,577 |
| 2022 | $6,265 | $375,606 | $134,000 | $241,606 |
| 2021 | $5,680 | $279,040 | $77,000 | $202,040 |
| 2020 | $5,284 | $254,717 | $77,000 | $177,717 |
| 2019 | $4,738 | $228,458 | $56,750 | $171,708 |
| 2018 | $4,320 | $204,590 | $48,500 | $156,090 |
| 2017 | $3,561 | $166,889 | $37,250 | $129,639 |
| 2015 | $1,082 | $156,958 | $34,550 | $122,408 |
| 2014 | $1,082 | $156,019 | $34,550 | $121,469 |
Source: Public Records
Map
Nearby Homes
- 203 Eastern Valley Ln
- 32 Ac Cr 167
- 641 Cr 167 St
- 615 Cr 167
- 204 County Road 107
- 1429 County Road 140
- Lot 6 County Road 132
- Lot 5 County Road 132
- Lot 4 County Road 132
- Lot 7 County Road 132
- Lot 3 County Road 132
- TBD County Road 132
- 993 County Line Rd
- 34673 Us-82
- 34673 Us Highway 82
- 1375 County Road 176
- 3285 Roland Rd
- 3200 County Road 155
- 2199 Hawkins Rd
- 835 Club Lake Rd
- 889 County Road 153
- 791 County Road 153
- 997 County Road 153
- 1248 County Road 107
- 824 County Road 153
- 1021 County Road 153
- 1220 County Road 107
- 737 County Road 153
- 1318 County Road 107
- 1282 County Road 107
- 1037 County Road 153
- 958 County Road 153
- 1358 County Road 107
- 996 County Road 153
- 1138 County Road 107
- 1057 County Road 153
- 1092 County Road 107
- 681 County Road 153
- 1406 County Road 107
- 1159 County Road 153