Estimated Value: $217,032 - $290,000
--
Bed
--
Bath
1,379
Sq Ft
$194/Sq Ft
Est. Value
About This Home
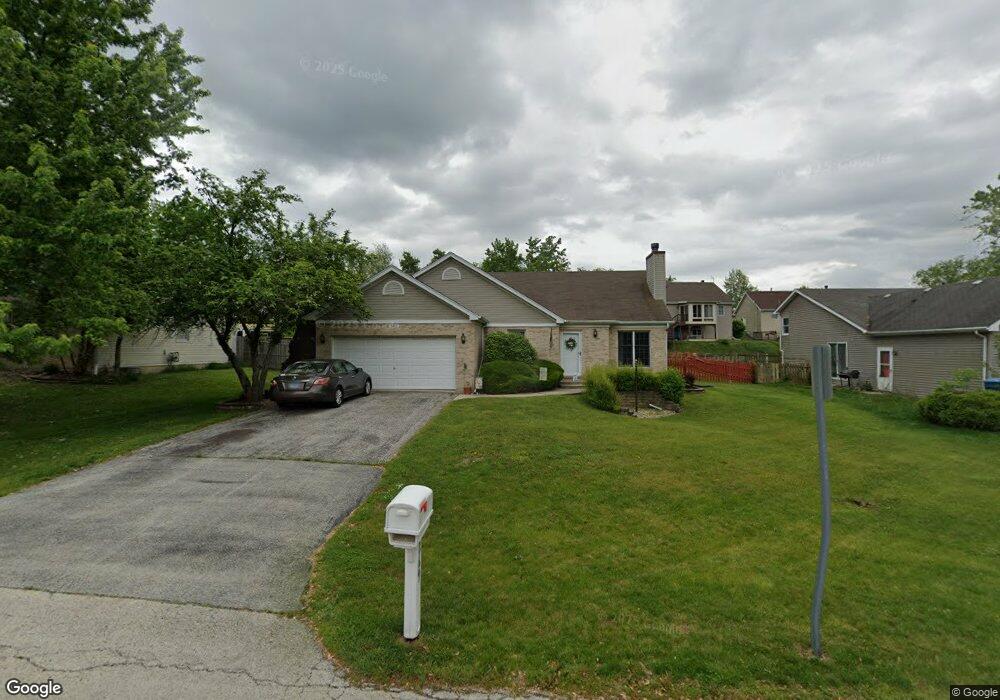
This home is located at 869 Dorsetshire Dr, Crete, IL 60417 and is currently estimated at $267,508, approximately $193 per square foot. 869 Dorsetshire Dr is a home located in Will County with nearby schools including Crete Elementary School, Crete-Monee Middle School, and Crete-Monee High School.
Ownership History
Date
Name
Owned For
Owner Type
Purchase Details
Closed on
Sep 10, 2007
Sold by
Powell Russell E and Millar Sara
Bought by
Powell Russell E
Current Estimated Value
Home Financials for this Owner
Home Financials are based on the most recent Mortgage that was taken out on this home.
Original Mortgage
$141,400
Outstanding Balance
$89,800
Interest Rate
6.63%
Mortgage Type
New Conventional
Estimated Equity
$177,708
Purchase Details
Closed on
Oct 14, 2002
Sold by
Grzybek Joseph and Grzybek Charlotte
Bought by
Powell Russell E and Millar Sara
Home Financials for this Owner
Home Financials are based on the most recent Mortgage that was taken out on this home.
Original Mortgage
$113,500
Interest Rate
6.13%
Purchase Details
Closed on
Jul 21, 2000
Sold by
Grzybek Joseph and Grzybek Charlotte
Bought by
Grzybek Joseph and Grzybek Charlotte
Purchase Details
Closed on
Sep 16, 1994
Sold by
Endor Inc
Bought by
Grzybek Joseph and Grzybek Charlotte
Create a Home Valuation Report for This Property
The Home Valuation Report is an in-depth analysis detailing your home's value as well as a comparison with similar homes in the area
Home Values in the Area
Average Home Value in this Area
Purchase History
| Date | Buyer | Sale Price | Title Company |
|---|---|---|---|
| Powell Russell E | -- | First American Title | |
| Powell Russell E | $147,500 | Ticor Title | |
| Grzybek Joseph | -- | -- | |
| Grzybek Joseph | $135,000 | -- |
Source: Public Records
Mortgage History
| Date | Status | Borrower | Loan Amount |
|---|---|---|---|
| Open | Powell Russell E | $141,400 | |
| Closed | Powell Russell E | $113,500 |
Source: Public Records
Tax History Compared to Growth
Tax History
| Year | Tax Paid | Tax Assessment Tax Assessment Total Assessment is a certain percentage of the fair market value that is determined by local assessors to be the total taxable value of land and additions on the property. | Land | Improvement |
|---|---|---|---|---|
| 2024 | $7,074 | $75,434 | $15,075 | $60,359 |
| 2023 | $7,074 | $67,358 | $13,461 | $53,897 |
| 2022 | $6,827 | $59,863 | $11,963 | $47,900 |
| 2021 | $5,948 | $54,809 | $10,953 | $43,856 |
| 2020 | $5,785 | $51,367 | $10,265 | $41,102 |
| 2019 | $5,540 | $48,278 | $9,648 | $38,630 |
| 2018 | $5,454 | $47,238 | $9,440 | $37,798 |
| 2017 | $5,140 | $43,517 | $8,696 | $34,821 |
| 2016 | $5,105 | $43,236 | $8,640 | $34,596 |
| 2015 | $5,663 | $42,079 | $8,409 | $33,670 |
| 2014 | $5,663 | $42,504 | $8,494 | $34,010 |
| 2013 | $5,663 | $50,129 | $9,597 | $40,532 |
Source: Public Records
Map
Nearby Homes
- 873 Yorkshire Terrace
- 1605 W Richton Rd
- 3604 Tee Ct N
- 246 Lakeview Ct
- 262 Lakeview Ct
- 200 Durham Dr
- 106 Cornwall Dr
- 129 Dorsetshire Dr
- 205 Hereford Ave
- 3501 Florence Ave
- 274 E 34th St
- 26 E 35th St
- 3755 S State St
- 3449 Somerset St
- 39 Hereford Dr
- 3728 Chicago Rd
- 3706 Chicago Rd
- 1011 S Dixie Hwy
- 39 Mckinley Ave
- 3228 Butler Ave
- 875 Dorsetshire Dr
- 865 Dorsetshire Dr
- 866 Wilshire Ln
- 864 Wilshire Ln
- 872 Wilshire Ln
- 879 Dorsetshire Dr
- 868 Dorsetshire Dr
- 876 Dorsetshire Dr
- 878 Wilshire Ln
- 883 Dorsetshire Dr
- 880 Dorsetshire Dr
- 858 Wilshire Ln
- 882 Wilshire Ln
- 865 Wilshire Ln
- 886 Wilshire Ln
- 871 Wilshire Ln
- 863 Wilshire Ln
- 889 Dorsetshire Dr
- 860 Dorsetshire Dr
- 877 Wilshire Ln