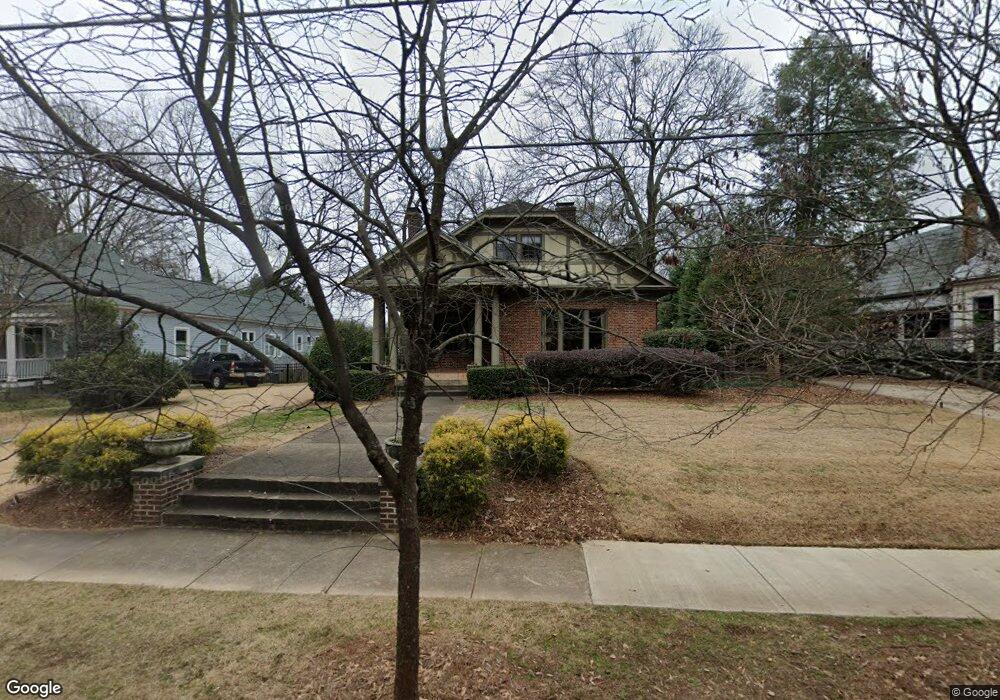
869 Hill St Athens, GA 30606
Cobbham NeighborhoodEstimated Value: $1,100,645 - $1,321,000
5
Beds
3
Baths
3,496
Sq Ft
$338/Sq Ft
Est. Value
About This Home
This home is located at 869 Hill St, Athens, GA 30606 and is currently estimated at $1,182,215, approximately $338 per square foot. 869 Hill St is a home located in Clarke County with nearby schools including Johnnie Lay Burks Elementary School, Clarke Middle School, and Clarke Central High School.
Ownership History
Date
Name
Owned For
Owner Type
Purchase Details
Closed on
Jan 16, 2009
Sold by
Barnett Mary M
Bought by
Barnett A. K
Current Estimated Value
Home Financials for this Owner
Home Financials are based on the most recent Mortgage that was taken out on this home.
Original Mortgage
$417,000
Outstanding Balance
$263,277
Interest Rate
5.24%
Mortgage Type
New Conventional
Estimated Equity
$918,938
Purchase Details
Closed on
Jan 25, 2008
Sold by
Barnett A Karl
Bought by
Barnett Mary M
Home Financials for this Owner
Home Financials are based on the most recent Mortgage that was taken out on this home.
Original Mortgage
$417,000
Interest Rate
6.17%
Mortgage Type
New Conventional
Purchase Details
Closed on
Mar 31, 2006
Sold by
Not Provided
Bought by
Barnett Mary M
Home Financials for this Owner
Home Financials are based on the most recent Mortgage that was taken out on this home.
Original Mortgage
$418,400
Interest Rate
6.2%
Mortgage Type
New Conventional
Purchase Details
Closed on
Nov 18, 2005
Sold by
Evans Alva Jo
Bought by
Dawg Country Properties Inc
Create a Home Valuation Report for This Property
The Home Valuation Report is an in-depth analysis detailing your home's value as well as a comparison with similar homes in the area
Home Values in the Area
Average Home Value in this Area
Purchase History
| Date | Buyer | Sale Price | Title Company |
|---|---|---|---|
| Barnett A. K | -- | -- | |
| Barnett Mary M | -- | -- | |
| Barnet A Karl | $569,150 | -- | |
| Barnett Mary M | $310,000 | -- | |
| Dawg Country Properties Inc | $256,000 | -- |
Source: Public Records
Mortgage History
| Date | Status | Borrower | Loan Amount |
|---|---|---|---|
| Open | Barnett A. K | $417,000 | |
| Previous Owner | Barnet A Karl | $417,000 | |
| Previous Owner | Barnett Mary M | $418,400 | |
| Closed | Dawg Country Properties Inc | $0 |
Source: Public Records
Tax History
| Year | Tax Paid | Tax Assessment Tax Assessment Total Assessment is a certain percentage of the fair market value that is determined by local assessors to be the total taxable value of land and additions on the property. | Land | Improvement |
|---|---|---|---|---|
| 2025 | $14,757 | $501,782 | $54,000 | $447,782 |
| 2024 | $14,757 | $474,956 | $54,000 | $420,956 |
| 2023 | $14,343 | $399,868 | $54,000 | $345,868 |
| 2022 | $10,058 | $325,288 | $54,000 | $271,288 |
| 2021 | $9,162 | $281,856 | $54,000 | $227,856 |
| 2020 | $8,552 | $263,762 | $54,000 | $209,762 |
| 2019 | $8,230 | $252,430 | $54,000 | $198,430 |
| 2018 | $7,686 | $236,382 | $54,000 | $182,382 |
| 2017 | $7,393 | $227,769 | $54,000 | $173,769 |
| 2016 | $7,169 | $221,176 | $54,000 | $167,176 |
| 2015 | $6,432 | $199,152 | $48,000 | $151,152 |
| 2014 | $6,441 | $199,152 | $48,000 | $151,152 |
Source: Public Records
Map
Nearby Homes
- 480 N Billups St
- 1196 W Hancock Ave Unit 1
- 1198 W West Hancock Ave W
- 923 Hill St
- 552 Cobb St
- 271 King Ave
- 524 Hill St
- 1226 W Broad St
- 458 Dearing St
- 570 Prince Ave
- 215 Holman Ave
- 303 S Church St
- 303 S Church St Unit 6
- 145 Sunset Dr
- 282 Holman Ave
- 947 N Chase St
- 935 Baxter St Unit 3
- 277 Evans St
- 375 Best Dr
- 100 Prince Ave Unit A404
- 847 Hill St
- 135 Glenhaven Ave
- 889 Hill St
- 145 Glenhaven Ave
- 835 Hill St Unit A
- 125 Glenhaven Ave
- 825 Hill St
- 891 Hill St
- 101 The Plaza
- 155 Glenhaven Ave Unit 1
- 165 Glenhaven Ave
- 115 The Plaza
- 115 The Plaza
- 880 Hill St
- 870 Hill St
- 175 Glenhaven Ave
- 180 Glenhaven Ave
- 125 The Plaza
- 846 Hill St
- 858 Hill St
Your Personal Tour Guide
Ask me questions while you tour the home.