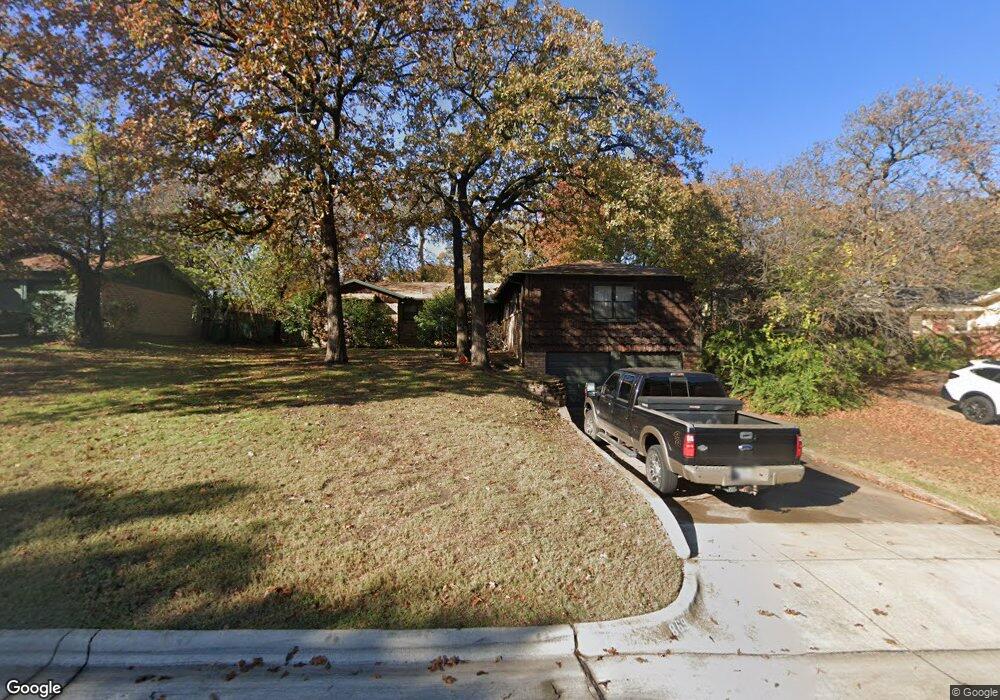
869 Patti Dr Bedford, TX 76022
Estimated Value: $347,000 - $386,000
3
Beds
3
Baths
2,012
Sq Ft
$179/Sq Ft
Est. Value
About This Home
This home is located at 869 Patti Dr, Bedford, TX 76022 and is currently estimated at $360,204, approximately $179 per square foot. 869 Patti Dr is a home located in Tarrant County with nearby schools including Stonegate Elementary School, Central J High School, and L.D. Bell High School.
Ownership History
Date
Name
Owned For
Owner Type
Purchase Details
Closed on
Mar 31, 2020
Sold by
Spurlock Regina L
Bought by
Amadror Meredith Leigh
Current Estimated Value
Home Financials for this Owner
Home Financials are based on the most recent Mortgage that was taken out on this home.
Original Mortgage
$217,125
Outstanding Balance
$194,869
Interest Rate
4.12%
Mortgage Type
FHA
Estimated Equity
$165,335
Purchase Details
Closed on
Aug 28, 1995
Sold by
Evans Glenn L and Evans Betty J
Bought by
Spurlock Regina L
Home Financials for this Owner
Home Financials are based on the most recent Mortgage that was taken out on this home.
Original Mortgage
$82,650
Interest Rate
7.6%
Purchase Details
Closed on
Dec 21, 1994
Sold by
Keller Lila Jane
Bought by
Evans Glenn L and Evans Betty
Home Financials for this Owner
Home Financials are based on the most recent Mortgage that was taken out on this home.
Original Mortgage
$115,000
Interest Rate
9.07%
Mortgage Type
Seller Take Back
Create a Home Valuation Report for This Property
The Home Valuation Report is an in-depth analysis detailing your home's value as well as a comparison with similar homes in the area
Home Values in the Area
Average Home Value in this Area
Purchase History
| Date | Buyer | Sale Price | Title Company |
|---|---|---|---|
| Amadror Meredith Leigh | -- | Fatco | |
| Spurlock Regina L | -- | American Title Company | |
| Evans Glenn L | -- | American Title |
Source: Public Records
Mortgage History
| Date | Status | Borrower | Loan Amount |
|---|---|---|---|
| Open | Amadror Meredith Leigh | $217,125 | |
| Previous Owner | Spurlock Regina L | $82,650 | |
| Previous Owner | Evans Glenn L | $115,000 |
Source: Public Records
Tax History Compared to Growth
Tax History
| Year | Tax Paid | Tax Assessment Tax Assessment Total Assessment is a certain percentage of the fair market value that is determined by local assessors to be the total taxable value of land and additions on the property. | Land | Improvement |
|---|---|---|---|---|
| 2025 | $5,283 | $345,982 | $65,000 | $280,982 |
| 2024 | $5,283 | $345,982 | $65,000 | $280,982 |
| 2023 | $5,870 | $334,203 | $45,000 | $289,203 |
| 2022 | $6,077 | $289,012 | $45,000 | $244,012 |
| 2021 | $5,958 | $252,950 | $45,000 | $207,950 |
| 2020 | $4,972 | $209,118 | $45,000 | $164,118 |
| 2019 | $4,892 | $201,376 | $45,000 | $156,376 |
| 2018 | $4,087 | $183,944 | $22,000 | $161,944 |
| 2017 | $4,045 | $180,844 | $22,000 | $158,844 |
| 2016 | $3,678 | $159,739 | $22,000 | $137,739 |
| 2015 | $3,196 | $138,200 | $18,000 | $120,200 |
| 2014 | $3,196 | $138,200 | $18,000 | $120,200 |
Source: Public Records
Map
Nearby Homes
- 933 Wade Dr
- 1108 Wade Dr
- 849 Russell Ln
- 1008 Russell Ln
- 501 Merrill Dr
- 832 Chateau Valee Cir
- 341 Hurst Dr
- 344 Bedford Ct E
- 604 Donna Ln
- 1112 Ann St
- 1236 King Dr
- 803 Glenda Dr
- 909 Overhill Dr
- 921 Overhill Dr
- 802 Brown Trail
- 1204 Edgecliff Dr
- 905 Brown Trail
- 1200 Tanglewood Trail
- 1004 Overhill Dr
- 1213 Briar Dr