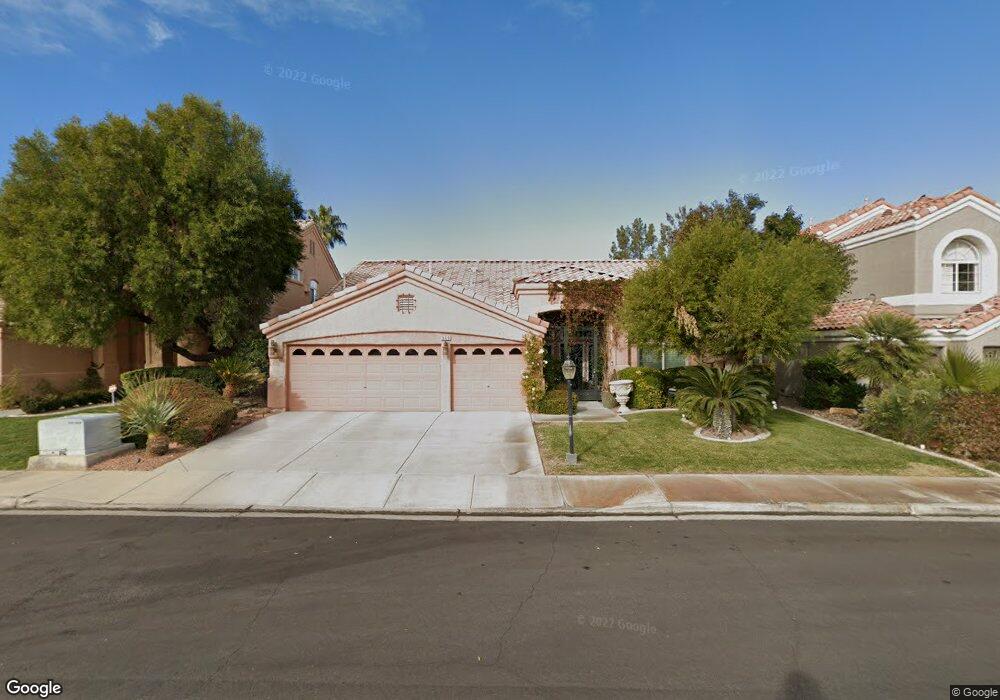
869 Rainbolt Ln Unit 1 Henderson, NV 89052
MacDonald Ranch NeighborhoodEstimated Value: $549,000 - $591,000
4
Beds
3
Baths
2,126
Sq Ft
$268/Sq Ft
Est. Value
About This Home
This home is located at 869 Rainbolt Ln Unit 1, Henderson, NV 89052 and is currently estimated at $569,041, approximately $267 per square foot. 869 Rainbolt Ln Unit 1 is a home located in Clark County with nearby schools including Frank S Lamping Elementary School, Del E. Webb Middle School, and Coronado High School.
Ownership History
Date
Name
Owned For
Owner Type
Purchase Details
Closed on
Jun 6, 2006
Sold by
Burnett Rex C
Bought by
Lee L and Capitol Trust
Current Estimated Value
Purchase Details
Closed on
Dec 1, 2004
Sold by
Severson Roderick Q and Severson Karla S
Bought by
Burnett Rex C
Home Financials for this Owner
Home Financials are based on the most recent Mortgage that was taken out on this home.
Original Mortgage
$373,500
Interest Rate
5.76%
Mortgage Type
Unknown
Purchase Details
Closed on
Mar 21, 2000
Sold by
Rainey Vernon C and Rainey Alma Tean
Bought by
Severson Roderick Q and Severson Karla S
Home Financials for this Owner
Home Financials are based on the most recent Mortgage that was taken out on this home.
Original Mortgage
$197,600
Interest Rate
8.38%
Purchase Details
Closed on
Jun 2, 1999
Sold by
Scholt Phillip A and Scholt Bobbikay
Bought by
Brandise Harry
Create a Home Valuation Report for This Property
The Home Valuation Report is an in-depth analysis detailing your home's value as well as a comparison with similar homes in the area
Home Values in the Area
Average Home Value in this Area
Purchase History
| Date | Buyer | Sale Price | Title Company |
|---|---|---|---|
| Lee L | -- | None Available | |
| Burnett Rex C | $415,000 | Old Republic Title Co Of Nv | |
| Severson Roderick Q | $208,000 | First American Title Co | |
| Brandise Harry | $11,500 | -- |
Source: Public Records
Mortgage History
| Date | Status | Borrower | Loan Amount |
|---|---|---|---|
| Previous Owner | Burnett Rex C | $373,500 | |
| Previous Owner | Severson Roderick Q | $197,600 |
Source: Public Records
Tax History Compared to Growth
Tax History
| Year | Tax Paid | Tax Assessment Tax Assessment Total Assessment is a certain percentage of the fair market value that is determined by local assessors to be the total taxable value of land and additions on the property. | Land | Improvement |
|---|---|---|---|---|
| 2025 | $2,627 | $132,347 | $49,350 | $82,997 |
| 2024 | $2,551 | $132,347 | $49,350 | $82,997 |
| 2023 | $2,551 | $123,211 | $44,450 | $78,761 |
| 2022 | $2,477 | $114,957 | $42,700 | $72,257 |
| 2021 | $2,405 | $107,050 | $38,150 | $68,900 |
| 2020 | $2,332 | $104,391 | $36,050 | $68,341 |
| 2019 | $2,264 | $99,282 | $31,850 | $67,432 |
| 2018 | $2,198 | $90,343 | $25,200 | $65,143 |
| 2017 | $2,650 | $91,412 | $25,200 | $66,212 |
| 2016 | $2,081 | $88,230 | $21,000 | $67,230 |
| 2015 | $2,077 | $82,252 | $18,550 | $63,702 |
| 2014 | $2,016 | $74,560 | $10,150 | $64,410 |
Source: Public Records
Map
Nearby Homes
- 871 Rainbolt Ln
- 2571 Swans Chance Ave
- 2566 Wiltshire Ave
- 955 Leadville Meadows Dr
- 861 Majestic Ridge Ct
- 848 Sandhill Sage St
- 2548 Sundew Ave
- 2455 Silver Blossom Ln
- 980 Upper Meadows Place
- 981 Leadville Meadows Dr
- 820 Sandhill Sage St
- 818 Sandhill Sage St
- 2556 Prince Edward Dr
- 776 Valley Rise Dr
- 861 Vegas View Dr
- 2266 Driftwood Tide Ave
- 816 Stannard Ct
- 917 Vegas View Dr
- 2579 Anchorgate Dr
- 2294 Dakota Sky Ct
- 867 Rainbolt Ln
- 865 Rainbolt Ln
- 873 Rainbolt Ln
- 2414 Moonstar Ln
- 875 Rainbolt Ln Unit 1
- 863 Rainbolt Ln
- 872 Rainbolt Ln
- 2412 Moonstar Ln
- 874 Rainbolt Ln
- 864 Rainbolt Ln
- 877 Rainbolt Ln
- 2563 Swans Chance Ave
- 2563 Swans Chance Ave Unit none
- 2561 Swans Chance Ave
- 2565 Swans Chance Ave
- 2565 Swans Chance Ave
- 2565 Swans Chance Ave Unit na
- 862 Rainbolt Ln
- 2559 Swans Chance Ave
- 2411 Moonstar Ln