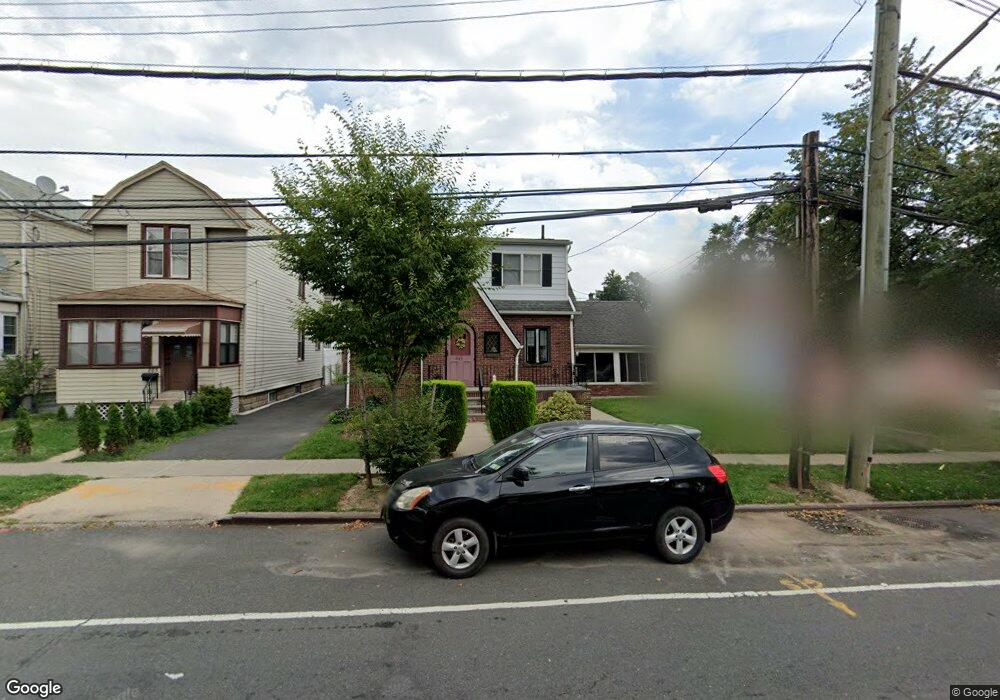
869 Targee St Staten Island, NY 10304
Concord NeighborhoodEstimated Value: $661,000 - $939,000
--
Bed
--
Bath
1,779
Sq Ft
$440/Sq Ft
Est. Value
About This Home
This home is located at 869 Targee St, Staten Island, NY 10304 and is currently estimated at $783,608, approximately $440 per square foot. 869 Targee St is a home located in Richmond County with nearby schools including P.S. 48 - William C. Wilcox, I.S. 49 Berta A Dreyfus, and New Dorp High School.
Ownership History
Date
Name
Owned For
Owner Type
Purchase Details
Closed on
Oct 12, 2022
Sold by
Ballard Doreen Ann
Bought by
Raskin Jennine M and Ballard Kevin
Current Estimated Value
Purchase Details
Closed on
Feb 8, 2019
Sold by
Raskin Jennine M and Ballard Kevin
Bought by
Raskin Jennine M and Ballard Kevin
Purchase Details
Closed on
May 8, 2006
Sold by
Ballard Robert J and Raskin Jennine M
Bought by
Raskin Jennine M and Ballard Kevin
Purchase Details
Closed on
Aug 26, 2003
Sold by
Ballard Robert J and Raskin Jennine M
Bought by
Ballard Robert J and Raskin Jennine M
Purchase Details
Closed on
Dec 13, 2001
Sold by
Ballard Jeanne H
Bought by
Ballard Robert J and Raskin Jennine M
Create a Home Valuation Report for This Property
The Home Valuation Report is an in-depth analysis detailing your home's value as well as a comparison with similar homes in the area
Home Values in the Area
Average Home Value in this Area
Purchase History
| Date | Buyer | Sale Price | Title Company |
|---|---|---|---|
| Raskin Jennine M | -- | None Listed On Document | |
| Ballard Doreen Ann | -- | None Listed On Document | |
| Raskin Jennine M | -- | None Available | |
| Raskin Jennine M | -- | None Available | |
| Ballard Robert J | -- | -- | |
| Ballard Robert J | -- | -- |
Source: Public Records
Tax History Compared to Growth
Tax History
| Year | Tax Paid | Tax Assessment Tax Assessment Total Assessment is a certain percentage of the fair market value that is determined by local assessors to be the total taxable value of land and additions on the property. | Land | Improvement |
|---|---|---|---|---|
| 2025 | $5,674 | $42,000 | $10,808 | $31,192 |
| 2024 | $5,778 | $44,820 | $9,554 | $35,266 |
| 2023 | $5,850 | $34,646 | $8,120 | $26,526 |
| 2022 | $5,630 | $50,220 | $12,360 | $37,860 |
| 2021 | $5,510 | $41,580 | $12,360 | $29,220 |
| 2020 | $5,209 | $37,980 | $12,360 | $25,620 |
| 2019 | $4,778 | $37,080 | $12,360 | $24,720 |
| 2018 | $4,639 | $28,872 | $8,424 | $20,448 |
| 2017 | $4,843 | $28,654 | $10,356 | $18,298 |
| 2016 | $4,440 | $27,033 | $10,332 | $16,701 |
| 2015 | $3,722 | $25,503 | $9,119 | $16,384 |
| 2014 | $3,722 | $24,060 | $10,320 | $13,740 |
Source: Public Records
Map
Nearby Homes
- 1890 Clove Rd
- 0 Douglas Rd
- 561 Hanover Ave
- 24 Roosevelt St
- 15 Roosevelt St
- 1 Douglas Ct
- 72 Alan Loop
- 751 Targee St
- 325 Oder Ave
- 315 Oder Ave
- 31 Alan Loop Unit 65
- 13 Wilson Terrace
- 448 Neckar Ave
- 1 Neckar Ave
- 164 Stonegate Dr
- 174 Pierce St
- 4 Sheridan Ave
- 113 Longview Rd
- 190A Pierce St
- 190 Pierce St Unit A