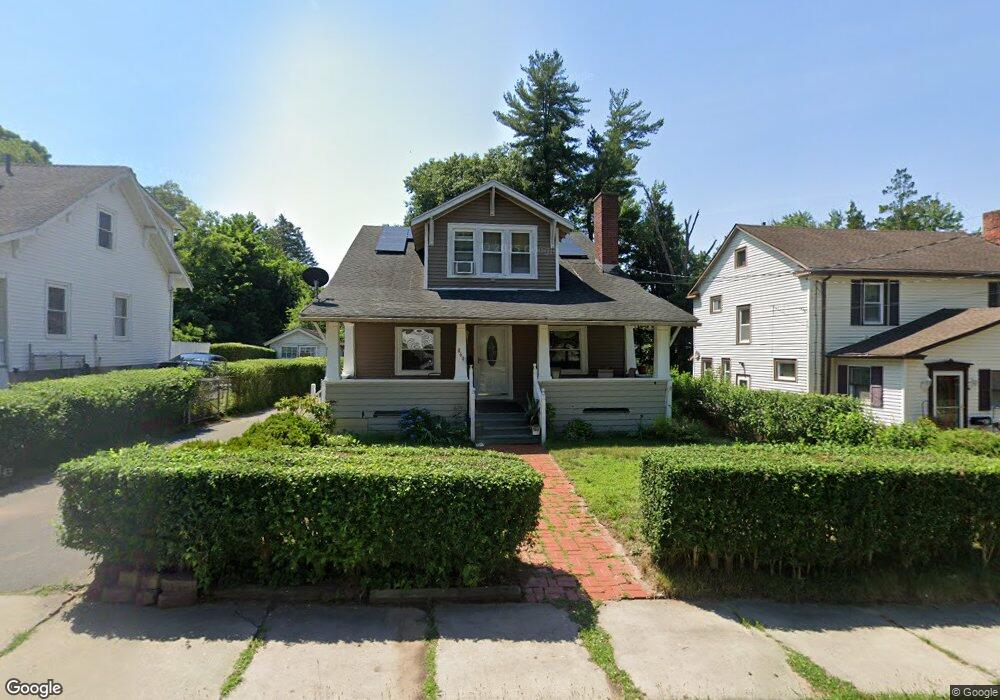
869 Tower Ave Hartford, CT 06112
Blue Hills NeighborhoodEstimated Value: $255,000 - $302,000
5
Beds
2
Baths
1,764
Sq Ft
$156/Sq Ft
Est. Value
About This Home
This home is located at 869 Tower Ave, Hartford, CT 06112 and is currently estimated at $275,004, approximately $155 per square foot. 869 Tower Ave is a home located in Hartford County with nearby schools including Rawson School, Breakthrough Magnet School - North Campus, and West Middle School.
Ownership History
Date
Name
Owned For
Owner Type
Purchase Details
Closed on
Nov 13, 2001
Sold by
Galske Gregory
Bought by
Shields Oswald
Current Estimated Value
Home Financials for this Owner
Home Financials are based on the most recent Mortgage that was taken out on this home.
Original Mortgage
$96,200
Interest Rate
6.77%
Mortgage Type
Purchase Money Mortgage
Purchase Details
Closed on
Aug 29, 2001
Sold by
Smith Martha Est and Thibodeau
Bought by
Galske Gregory
Create a Home Valuation Report for This Property
The Home Valuation Report is an in-depth analysis detailing your home's value as well as a comparison with similar homes in the area
Home Values in the Area
Average Home Value in this Area
Purchase History
| Date | Buyer | Sale Price | Title Company |
|---|---|---|---|
| Shields Oswald | $97,000 | -- | |
| Galske Gregory | $65,000 | -- |
Source: Public Records
Mortgage History
| Date | Status | Borrower | Loan Amount |
|---|---|---|---|
| Open | Galske Gregory | $170,000 | |
| Closed | Galske Gregory | $138,750 | |
| Closed | Galske Gregory | $115,000 | |
| Closed | Galske Gregory | $96,200 |
Source: Public Records
Tax History
| Year | Tax Paid | Tax Assessment Tax Assessment Total Assessment is a certain percentage of the fair market value that is determined by local assessors to be the total taxable value of land and additions on the property. | Land | Improvement |
|---|---|---|---|---|
| 2025 | $5,070 | $73,537 | $5,623 | $67,914 |
| 2024 | $5,070 | $73,537 | $5,623 | $67,914 |
| 2023 | $5,070 | $73,537 | $5,623 | $67,914 |
| 2022 | $5,070 | $73,537 | $5,623 | $67,914 |
| 2021 | $3,848 | $51,800 | $6,685 | $45,115 |
| 2020 | $3,848 | $51,800 | $6,685 | $45,115 |
| 2019 | $3,848 | $51,800 | $6,685 | $45,115 |
| 2018 | $3,719 | $50,054 | $6,460 | $43,594 |
| 2016 | $3,582 | $48,218 | $6,152 | $42,066 |
| 2015 | $3,582 | $45,928 | $5,860 | $40,068 |
| 2014 | $3,329 | $44,805 | $5,716 | $39,089 |
Source: Public Records
Map
Nearby Homes
- 90 Manchester St
- 200 Hartland St
- 216 Cornwall St
- 171 N Canaan St
- 83-85 Colebrook St
- 11-13 Pershing St
- 180 Brookline Ave
- 51 Pembroke St
- 26-28 Baltic St
- 110 Darby St
- 18 Darby St
- 747 Blue Hills Ave
- 97 Boothbay St
- 97 E Burnham St
- 25 Cornwall St
- 39 Burlington St
- 165 Bloomfield Ave
- 55 Sunny Reach Dr
- 111 Bloomfield Ave
- 148 Kent St Unit 150
Your Personal Tour Guide
Ask me questions while you tour the home.