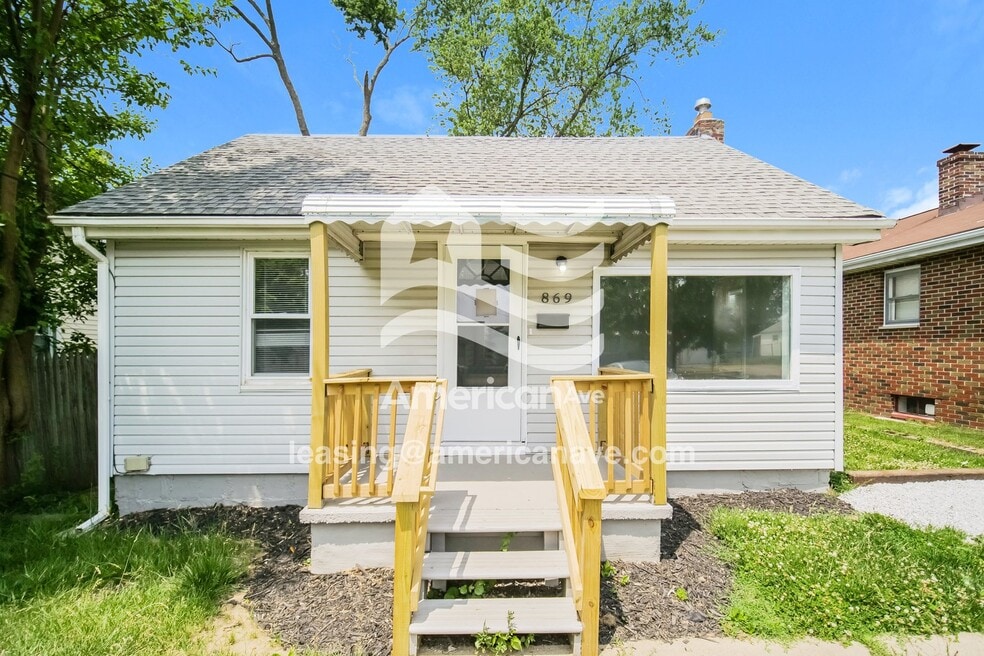
869 Triplett Blvd Akron, OH 44306
Firestone Park NeighborhoodAbout This Home
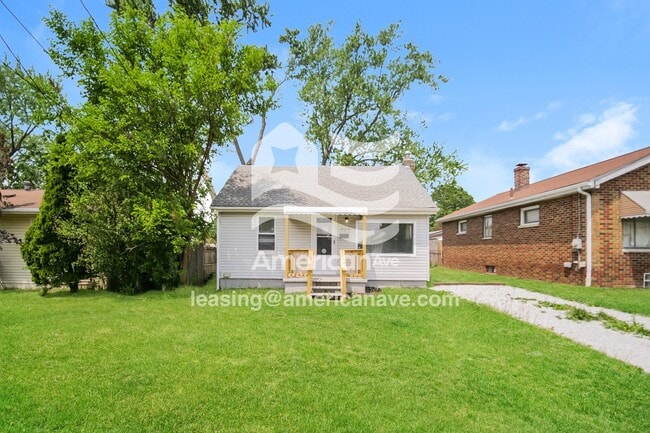
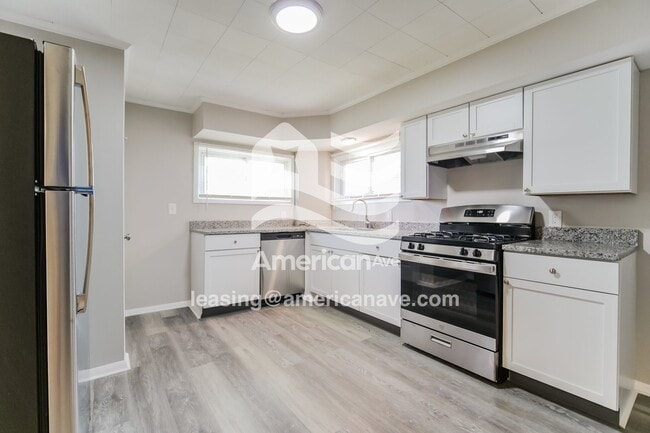
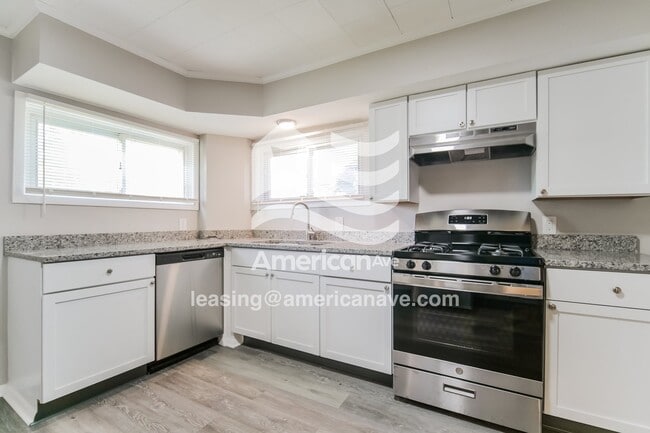
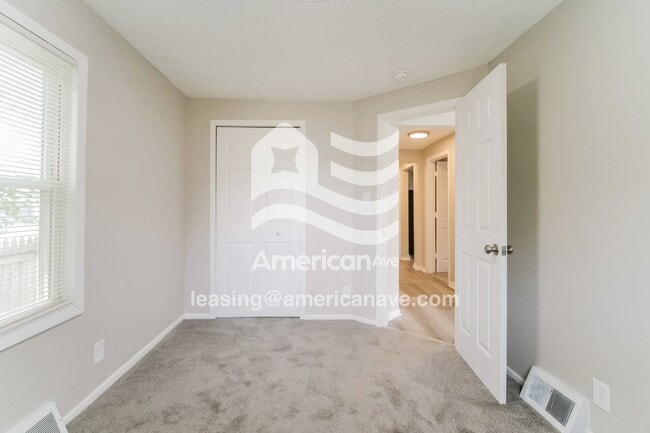
Step into this newly-remodeled and refreshed 3-bedroom, 1-bath home on Triplett Blvd.
We are pet-friendly! Your dogs and cats are welcome at 869 Triplett Boulevard.
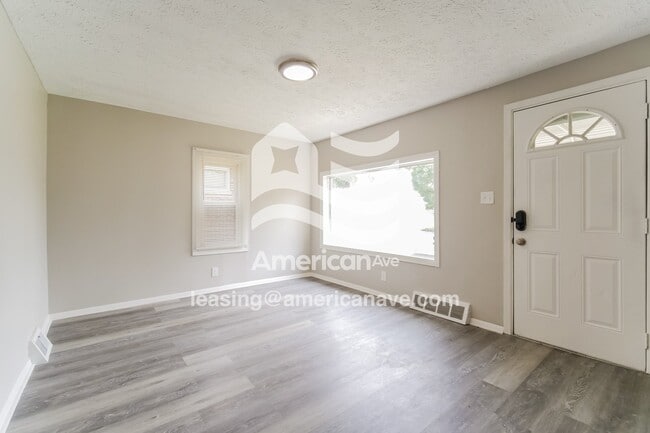
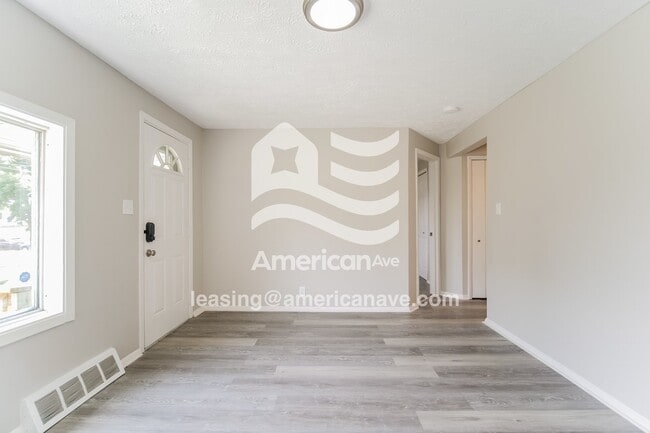
Modern updates define this home's inviting character. Inside, find desirable features like whole-home Air Conditioning, convenient washer/dryer hookups, and a kitchen equipped with granite/quartz surfaces, a refrigerator, a gas stove/oven, and a Dishwasher The home showcases durable luxury vinyl plank floors and sleek tiled bathrooms, blending style with easy maintenance.
This one-story home is nestled on a private lot.
Park with confidence in your dedicated Driveway.
Click "Request a tour" to schedule your free self-tour.
In addition to the monthly rent, tenants are responsible for all utilities (gas, electric, water, and sewer), a monthly Resident Protection Plus+ ($53.68 per month), and a monthly Utility Bill Management ($14.99 per month) when utility bills are processed by American Avenue or Conservice rather than the tenant paying all utility bills directly. Other fees that may be incurred by tenants where permitted by state law may include monthly Animal Rent ($55 per pet per month), Late Fees ($95 per late payment), Notice Fees ($95 per demand letter), Returned Payment Fees ($50 per returned payment), charges for tenant-caused damage and violations, and additional charges or fees as detailed in the lease. Fees may be lower in certain states, please read your lease carefully for details.
Applications are processed in the order they are completed and received. We gladly accept Section 8 / Housing Choice Vouchers. We consider a variety of factors, including household income, estimated living expenses, and credit history in our application review process. Application does not guarantee a lease.
American Avenue is an Equal Housing Lessor under the FHA. Applicable local, state and federal laws may apply. Lease terms and conditions apply. This is not an offer to rent. You must submit additional information for review and approval. Listing features may not be accurate and should be confirmed by touring the home.
Avoid rental scams! American Avenue does not list homes on Facebook Marketplace or Craigslist. We will never ask you to pay money via Zelle, CashApp, Bitcoin, or any method outside our website. Do not trust anyone offering you this home for a lower price than you see advertised here.

Map
- 912 Lindsay Ave
- 785 Reed Ave
- 805 Georgia Ave Unit 807
- 791 Georgia Ave
- 824 Austin Ave
- 955 N Firestone Blvd
- 944 Donald Ave
- 787 Austin Ave
- 843 Davies Ave
- 1060 Georgia Ave
- 1180 Inman St
- 774 E Archwood Ave
- 650 Reed Ave
- 645 Reed Ave
- 626 E Wilbeth Rd
- 1314 Allendale Ave
- 1180 Hammel St
- 629 Donald Ave
- 633 Barbara Ave
- 1313 Coventry St
- 733-743 E Wilbeth Rd
- 958 Hunt St
- 976 Hunt St
- 955 Concord Ave
- 744 Colette Dr
- 976 Cole Ave
- 1118 Santee Ave
- 1210 Wyley Ave
- 1699 Sunset Ave
- 432 N Firestone Blvd Unit ID1061037P
- 1102 Neptune Ave
- 1040 Neptune Ave
- 1036 Neptune Ave
- 1085 Herberich Ave
- 1069 Herberich Ave
- 837 Mckinley Ave
- 1022 Herberich Ave
- 754 Mckinley Ave
- 728 Mckinley Ave
- 466 Adkins Ave