Estimated Value: $566,116
--
Bed
--
Bath
5,850
Sq Ft
$97/Sq Ft
Est. Value
About This Home
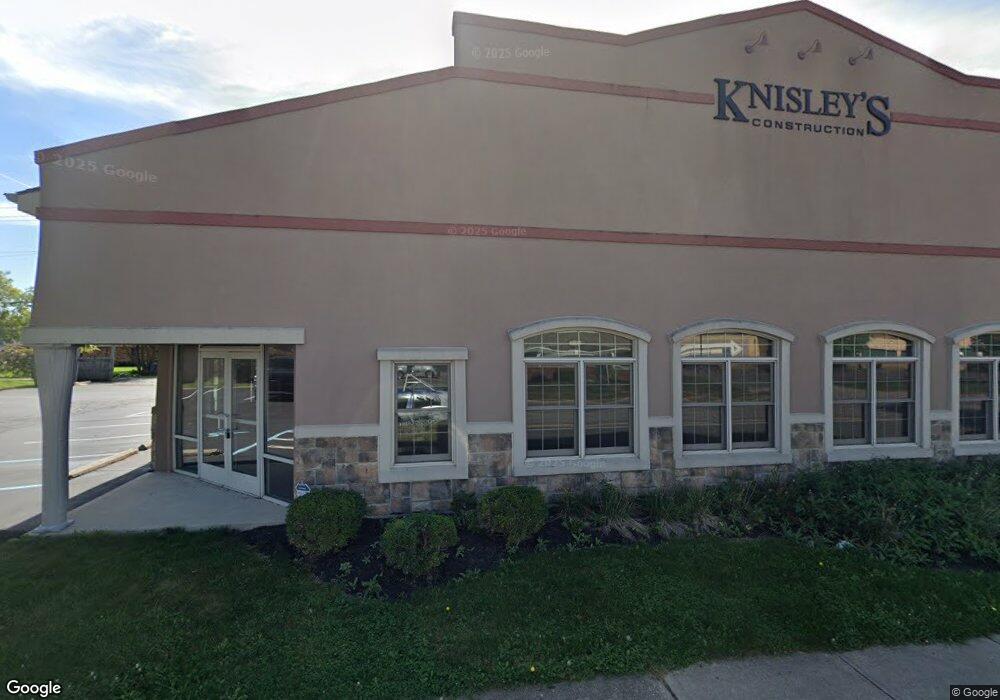
This home is located at 869 W 2nd St, Xenia, OH 45385 and is currently priced at $566,116, approximately $96 per square foot. 869 W 2nd St is a home located in Greene County with nearby schools including Xenia High School, Summit Academy Community School for Alternative Learners - Xenia, and Legacy Christian Academy.
Ownership History
Date
Name
Owned For
Owner Type
Purchase Details
Closed on
Mar 3, 2023
Sold by
Tmk Builders Llc
Bought by
Bixby Capital Llc
Current Estimated Value
Home Financials for this Owner
Home Financials are based on the most recent Mortgage that was taken out on this home.
Original Mortgage
$360,000
Outstanding Balance
$335,088
Interest Rate
6.09%
Mortgage Type
New Conventional
Purchase Details
Closed on
Jul 6, 2006
Sold by
Dicks Glass & Mirror Inc
Bought by
Tmk Builders Llc
Home Financials for this Owner
Home Financials are based on the most recent Mortgage that was taken out on this home.
Original Mortgage
$250,000
Interest Rate
6.68%
Mortgage Type
Construction
Purchase Details
Closed on
Jan 14, 2005
Sold by
Pham Luong and Liu Nancy
Bought by
Dicks Glass & Mirror Inc
Home Financials for this Owner
Home Financials are based on the most recent Mortgage that was taken out on this home.
Original Mortgage
$52,500
Interest Rate
5.83%
Mortgage Type
Commercial
Create a Home Valuation Report for This Property
The Home Valuation Report is an in-depth analysis detailing your home's value as well as a comparison with similar homes in the area
Home Values in the Area
Average Home Value in this Area
Purchase History
| Date | Buyer | Sale Price | Title Company |
|---|---|---|---|
| Bixby Capital Llc | $480,000 | -- | |
| Tmk Builders Llc | -- | None Available | |
| Dicks Glass & Mirror Inc | $70,000 | -- |
Source: Public Records
Mortgage History
| Date | Status | Borrower | Loan Amount |
|---|---|---|---|
| Open | Bixby Capital Llc | $360,000 | |
| Previous Owner | Tmk Builders Llc | $250,000 | |
| Previous Owner | Dicks Glass & Mirror Inc | $52,500 |
Source: Public Records
Tax History Compared to Growth
Tax History
| Year | Tax Paid | Tax Assessment Tax Assessment Total Assessment is a certain percentage of the fair market value that is determined by local assessors to be the total taxable value of land and additions on the property. | Land | Improvement |
|---|---|---|---|---|
| 2024 | $8,300 | $163,830 | $35,040 | $128,790 |
| 2023 | $8,300 | $163,830 | $35,040 | $128,790 |
| 2022 | $9,143 | $153,620 | $35,040 | $118,580 |
| 2021 | $9,285 | $153,620 | $35,040 | $118,580 |
| 2020 | $8,941 | $153,620 | $35,040 | $118,580 |
| 2019 | $9,034 | $149,290 | $35,040 | $114,250 |
| 2018 | $9,112 | $149,290 | $35,040 | $114,250 |
| 2017 | $9,298 | $149,290 | $35,040 | $114,250 |
| 2016 | $9,298 | $151,040 | $35,040 | $116,000 |
| 2015 | $9,328 | $151,040 | $35,040 | $116,000 |
| 2014 | $9,011 | $151,040 | $35,040 | $116,000 |
Source: Public Records
Map
Nearby Homes
- 880 Trumbull St
- 874 Trumbull St
- 868 Trumbull St
- 856 Trumbull St
- 896 Trumbull St
- 928 Trumbull St
- 845 Trumbull St
- 827 Trumbull St
- 32 S Allison Ave
- 206 S Allison Ave
- 214 S Allison Ave
- 985 W 2nd St
- 242 S Allison Ave
- 992 W 2nd St
- 225 S Allison Ave
- 215 S Allison Ave Unit 225
- 26 S Allison Ave
- 252 S Allison Ave
- 1009 W 2nd St
- 254 S Allison Ave