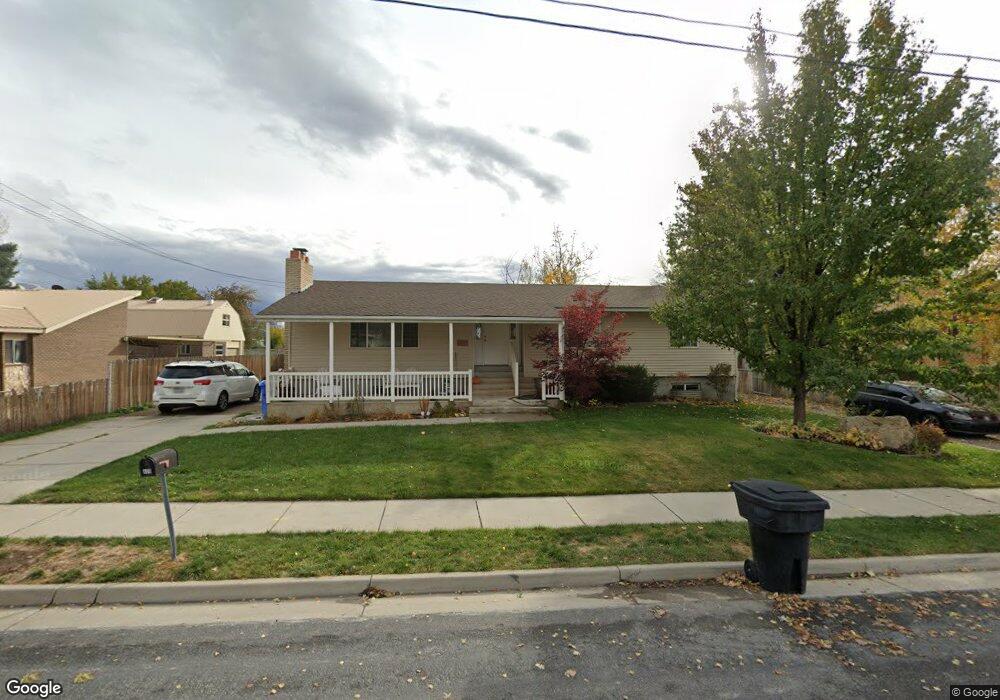
869 W 400 N West Bountiful, UT 84087
Estimated Value: $603,000 - $757,000
4
Beds
2
Baths
3,000
Sq Ft
$225/Sq Ft
Est. Value
About This Home
This home is located at 869 W 400 N, West Bountiful, UT 84087 and is currently estimated at $676,428, approximately $225 per square foot. 869 W 400 N is a home located in Davis County with nearby schools including West Bountiful Elementary School, Bountiful Junior High School, and Viewmont High School.
Ownership History
Date
Name
Owned For
Owner Type
Purchase Details
Closed on
Mar 29, 2024
Sold by
Vowles John Martell and Vowles April
Bought by
Hf Slnclair Woods Cross Refining Llc
Current Estimated Value
Purchase Details
Closed on
Jan 23, 2019
Sold by
Vowles John Martell and Vowles April
Bought by
Vowles John Martell and Vowles April
Home Financials for this Owner
Home Financials are based on the most recent Mortgage that was taken out on this home.
Original Mortgage
$251,500
Interest Rate
4.6%
Mortgage Type
New Conventional
Purchase Details
Closed on
Jun 20, 2014
Sold by
Dewaal Earl W and Dewaal Vickie L
Bought by
Vowles John Martell and Vowles April
Home Financials for this Owner
Home Financials are based on the most recent Mortgage that was taken out on this home.
Original Mortgage
$265,500
Interest Rate
4.16%
Mortgage Type
New Conventional
Purchase Details
Closed on
Oct 6, 1999
Sold by
Dewaal Earl W
Bought by
Dewaal Earl W and Dewaal Vickie L
Create a Home Valuation Report for This Property
The Home Valuation Report is an in-depth analysis detailing your home's value as well as a comparison with similar homes in the area
Home Values in the Area
Average Home Value in this Area
Purchase History
| Date | Buyer | Sale Price | Title Company |
|---|---|---|---|
| Hf Slnclair Woods Cross Refining Llc | -- | Us Title | |
| Vowles John Martell | -- | Backman Tithe Servi | |
| Vowles John Martell | -- | First American Title | |
| Dewaal Earl W | -- | Associated Title Company |
Source: Public Records
Mortgage History
| Date | Status | Borrower | Loan Amount |
|---|---|---|---|
| Previous Owner | Vowles John Martell | $251,500 | |
| Previous Owner | Vowles John Martell | $265,500 |
Source: Public Records
Tax History Compared to Growth
Tax History
| Year | Tax Paid | Tax Assessment Tax Assessment Total Assessment is a certain percentage of the fair market value that is determined by local assessors to be the total taxable value of land and additions on the property. | Land | Improvement |
|---|---|---|---|---|
| 2025 | $4,295 | $348,644 | $202,520 | $146,124 |
| 2024 | $4,030 | $336,793 | $173,496 | $163,297 |
| 2023 | $3,851 | $583,000 | $365,618 | $217,382 |
| 2022 | $3,962 | $337,700 | $196,199 | $141,501 |
| 2021 | $3,684 | $481,000 | $306,896 | $174,104 |
| 2020 | $3,189 | $408,000 | $249,414 | $158,586 |
| 2019 | $3,261 | $417,000 | $226,878 | $190,122 |
| 2018 | $2,967 | $370,000 | $181,025 | $188,975 |
| 2016 | $2,661 | $186,533 | $99,873 | $86,660 |
| 2015 | $2,631 | $177,403 | $99,873 | $77,530 |
| 2014 | $2,012 | $138,947 | $99,873 | $39,074 |
| 2013 | -- | $131,099 | $57,863 | $73,236 |
Source: Public Records
Map
Nearby Homes
- 767 W 220 N
- 280 N 1100 W
- 680 W 500 S Unit 22
- 680 W 500 S Unit 17
- 825 W 1320 N
- 340 N 500 W Unit 204
- 790 N 500 W
- 399 W 400 N Unit 47
- Carson Plan at Amberly Place
- 2050 Farmhouse Plan at Amberly Place
- Pasadena (Inactive) Plan at Amberly Place
- Portland Plan at Amberly Place
- 167 S 425 W
- 1067 W Audrey Ln Unit 8
- 1075 W Audrey Ln Unit 6
- 366 W 1000 N
- 1056 W Audrey Ln Unit 14
- 314 W Center St Unit D159
- 314 W Center St Unit E150
- 1064 W Audrey Ln Unit 15