Estimated Value: $478,000 - $489,450
5
Beds
2
Baths
1,501
Sq Ft
$322/Sq Ft
Est. Value
About This Home
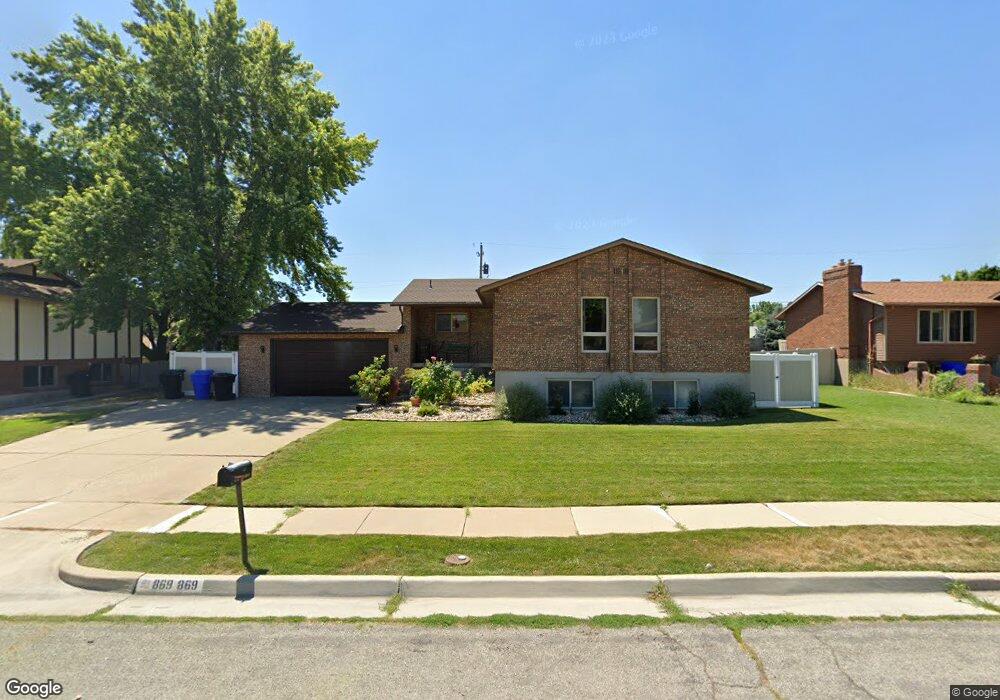
This home is located at 869 W 4250 S, Ogden, UT 84405 and is currently estimated at $483,863, approximately $322 per square foot. 869 W 4250 S is a home located in Weber County with nearby schools including Riverdale School, T.H. Bell Junior High School, and Bonneville High School.
Ownership History
Date
Name
Owned For
Owner Type
Purchase Details
Closed on
May 2, 2017
Sold by
Rozinka Michael J and Rozinka Patty J
Bought by
Rozinka Michael J and Rozinka Patty J
Current Estimated Value
Purchase Details
Closed on
Sep 3, 2002
Sold by
Rozinka Michael
Bought by
Rozinka Michael J and Rozinka Patty J
Home Financials for this Owner
Home Financials are based on the most recent Mortgage that was taken out on this home.
Original Mortgage
$116,400
Interest Rate
6.16%
Mortgage Type
Purchase Money Mortgage
Purchase Details
Closed on
Jan 29, 1996
Sold by
Rozinka Patty J
Bought by
Rozinka Michael
Home Financials for this Owner
Home Financials are based on the most recent Mortgage that was taken out on this home.
Original Mortgage
$124,000
Interest Rate
7.25%
Mortgage Type
Purchase Money Mortgage
Create a Home Valuation Report for This Property
The Home Valuation Report is an in-depth analysis detailing your home's value as well as a comparison with similar homes in the area
Home Values in the Area
Average Home Value in this Area
Purchase History
| Date | Buyer | Sale Price | Title Company |
|---|---|---|---|
| Rozinka Michael J | -- | None Available | |
| Rozinka Michael J | -- | Inwest Title | |
| Rozinka Michael | -- | Bonneville Title |
Source: Public Records
Mortgage History
| Date | Status | Borrower | Loan Amount |
|---|---|---|---|
| Closed | Rozinka Michael J | $116,400 | |
| Closed | Rozinka Michael | $124,000 |
Source: Public Records
Tax History Compared to Growth
Tax History
| Year | Tax Paid | Tax Assessment Tax Assessment Total Assessment is a certain percentage of the fair market value that is determined by local assessors to be the total taxable value of land and additions on the property. | Land | Improvement |
|---|---|---|---|---|
| 2025 | $2,895 | $512,002 | $140,004 | $371,998 |
| 2024 | $2,769 | $275,550 | $74,844 | $200,706 |
| 2023 | $2,563 | $253,000 | $75,809 | $177,191 |
| 2022 | $2,825 | $284,350 | $70,382 | $213,968 |
| 2021 | $1,852 | $341,000 | $68,154 | $272,846 |
| 2020 | $1,878 | $319,000 | $58,471 | $260,529 |
| 2019 | $1,828 | $294,000 | $52,488 | $241,512 |
| 2018 | $1,755 | $270,000 | $52,488 | $217,512 |
| 2017 | $1,607 | $236,000 | $43,503 | $192,497 |
| 2016 | $1,497 | $119,521 | $21,647 | $97,874 |
| 2015 | $1,489 | $116,302 | $21,647 | $94,655 |
| 2014 | $1,507 | $116,302 | $21,646 | $94,656 |
Source: Public Records
Map
Nearby Homes
- 902 W 4200 S
- 4265 S 950 W
- 4290 S 800 W
- 882 W 4150 S
- 875 W 4375 S
- 751 W 4350 S
- 780 W 4075 S
- 4409 S 850 W
- 1075 W 4175 S
- 4375 S Weber River Dr Unit 68
- 3975 Westwind Ct
- 4375 Weber River Dr
- 4375 Weber River Dr Unit 123
- 4375 Weber River Dr Unit 55
- 871 W 3875 S
- 621 Coachman Way
- 3937 S Lamplighter Way Unit 23
- 567 W 3950 S
- 1219 W 4500 S
- 3746 Parker Dr