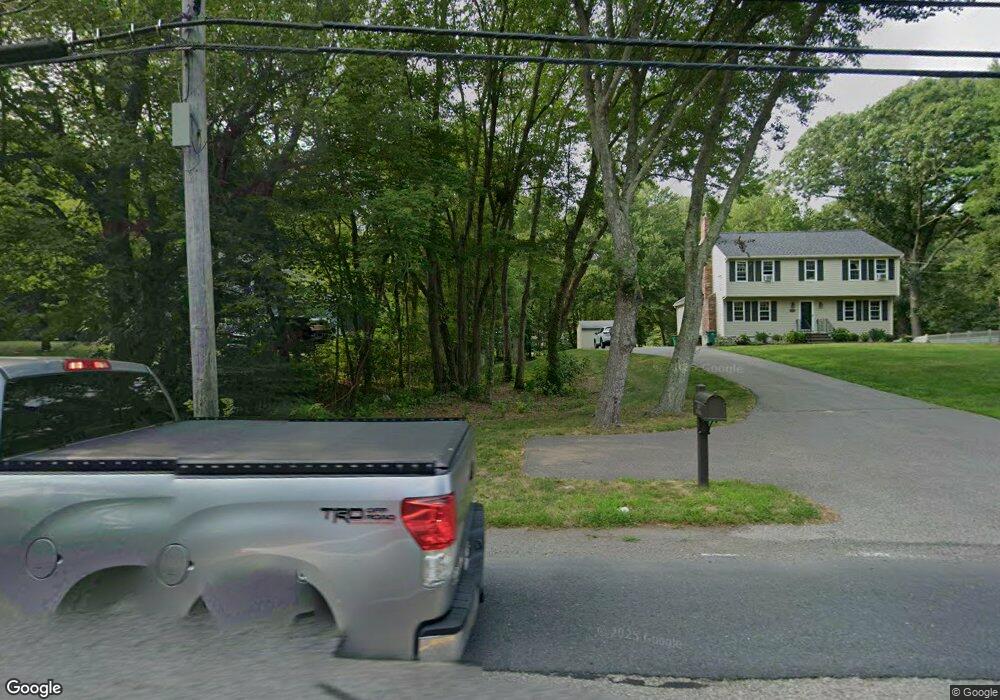
869 West St Mansfield, MA 02048
Estimated Value: $738,945 - $981,000
4
Beds
3
Baths
1,800
Sq Ft
$452/Sq Ft
Est. Value
About This Home
This home is located at 869 West St, Mansfield, MA 02048 and is currently estimated at $813,986, approximately $452 per square foot. 869 West St is a home located in Bristol County with nearby schools including Everett W. Robinson Elementary School, Jordan/Jackson Elementary School, and Harold L. Qualters Middle School.
Ownership History
Date
Name
Owned For
Owner Type
Purchase Details
Closed on
May 10, 2023
Sold by
White Tyra E
Bought by
Tyra E White T
Current Estimated Value
Purchase Details
Closed on
Nov 30, 1995
Sold by
Pisano John and Pisano Gerarda M
Bought by
White Richard J and White Tyra E
Home Financials for this Owner
Home Financials are based on the most recent Mortgage that was taken out on this home.
Original Mortgage
$166,500
Interest Rate
7.37%
Mortgage Type
Purchase Money Mortgage
Create a Home Valuation Report for This Property
The Home Valuation Report is an in-depth analysis detailing your home's value as well as a comparison with similar homes in the area
Home Values in the Area
Average Home Value in this Area
Purchase History
| Date | Buyer | Sale Price | Title Company |
|---|---|---|---|
| Tyra E White T | -- | None Available | |
| White Richard J | $185,000 | -- |
Source: Public Records
Mortgage History
| Date | Status | Borrower | Loan Amount |
|---|---|---|---|
| Previous Owner | White Richard J | $16,250 | |
| Previous Owner | White Richard J | $166,500 | |
| Previous Owner | White Richard J | $101,500 |
Source: Public Records
Tax History
| Year | Tax Paid | Tax Assessment Tax Assessment Total Assessment is a certain percentage of the fair market value that is determined by local assessors to be the total taxable value of land and additions on the property. | Land | Improvement |
|---|---|---|---|---|
| 2025 | $7,985 | $606,300 | $249,700 | $356,600 |
| 2024 | $7,893 | $584,700 | $249,700 | $335,000 |
| 2023 | $7,683 | $545,300 | $249,700 | $295,600 |
| 2022 | $7,429 | $489,700 | $232,800 | $256,900 |
| 2021 | $5,715 | $466,400 | $202,400 | $264,000 |
| 2020 | $6,927 | $451,000 | $193,600 | $257,400 |
| 2019 | $6,450 | $423,800 | $164,200 | $259,600 |
| 2018 | $5,279 | $412,800 | $157,600 | $255,200 |
| 2017 | $6,041 | $402,200 | $153,600 | $248,600 |
| 2016 | $5,822 | $377,800 | $147,000 | $230,800 |
| 2015 | $5,684 | $366,700 | $147,000 | $219,700 |
Source: Public Records
Map
Nearby Homes
- 1769 West St
- 346 South St
- 24 Maverick Dr
- 85 Jewell St
- 152 Central St
- 40 Treasure Island Rd
- 166 Chauncy St
- 356 Central St
- 16 Treasure Island Rd
- 14 Claire Ave
- 150 Gilbert St
- 150 Rumford Ave Unit 110
- 9 Coach Rd
- 33 Colonial Way
- 84 Messenger St
- 266 N Main St Unit 3
- 155 South St
- 46 Mirimichi St
- 22 Pleasant St Unit C
- 28 Court St
Your Personal Tour Guide
Ask me questions while you tour the home.