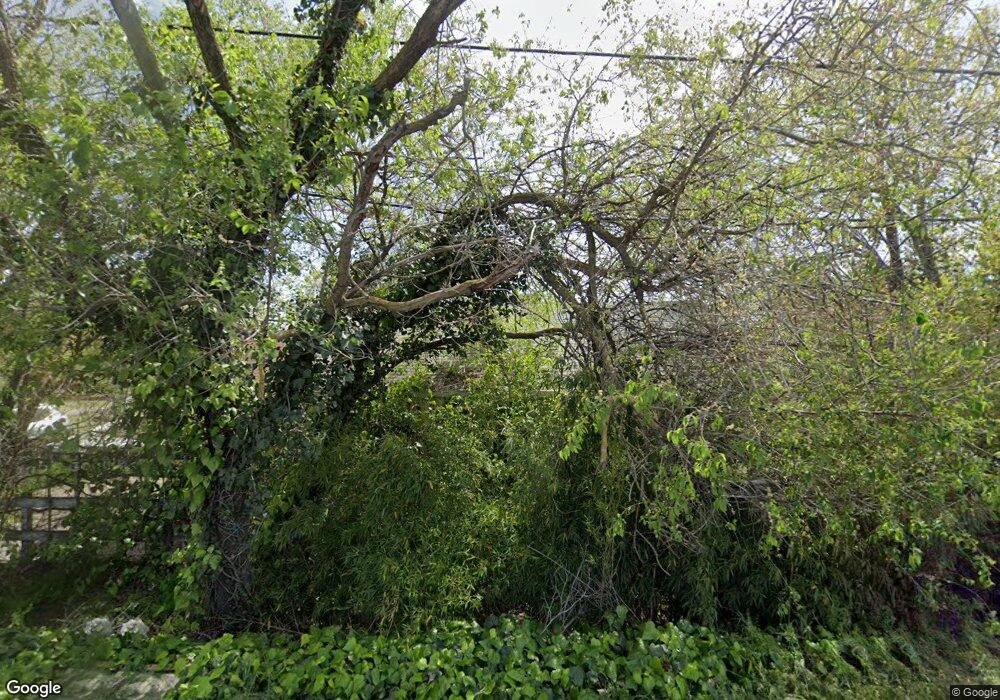
8690 Calvine Rd Sacramento, CA 95828
North East Elk Grove NeighborhoodEstimated Value: $634,000 - $862,000
2
Beds
1
Bath
798
Sq Ft
$953/Sq Ft
Est. Value
About This Home
This home is located at 8690 Calvine Rd, Sacramento, CA 95828 and is currently estimated at $760,526, approximately $953 per square foot. 8690 Calvine Rd is a home located in Sacramento County with nearby schools including Raymond Case Elementary School, Edward Harris Jr. Middle School, and Monterey Trail High School.
Ownership History
Date
Name
Owned For
Owner Type
Purchase Details
Closed on
Jun 25, 2025
Sold by
Scruton Christopher James
Bought by
Richmond American Homes Of Maryland Inc
Current Estimated Value
Purchase Details
Closed on
Dec 28, 1995
Sold by
Surjadi Rostina
Bought by
Scruton Christopher James
Home Financials for this Owner
Home Financials are based on the most recent Mortgage that was taken out on this home.
Original Mortgage
$60,000
Interest Rate
7.37%
Purchase Details
Closed on
Dec 11, 1995
Sold by
Wells Fargo Bank
Bought by
Scruton Christopher James
Home Financials for this Owner
Home Financials are based on the most recent Mortgage that was taken out on this home.
Original Mortgage
$60,000
Interest Rate
7.37%
Purchase Details
Closed on
Jun 12, 1995
Sold by
Clark Daniel Martin
Bought by
Wells Fargo N A
Create a Home Valuation Report for This Property
The Home Valuation Report is an in-depth analysis detailing your home's value as well as a comparison with similar homes in the area
Home Values in the Area
Average Home Value in this Area
Purchase History
| Date | Buyer | Sale Price | Title Company |
|---|---|---|---|
| Richmond American Homes Of Maryland Inc | $825,000 | First American Title Company | |
| Scruton Christopher James | -- | Fidelity National Title | |
| Scruton Christopher James | $80,000 | Fidelity National Title | |
| Wells Fargo N A | $76,192 | -- |
Source: Public Records
Mortgage History
| Date | Status | Borrower | Loan Amount |
|---|---|---|---|
| Previous Owner | Scruton Christopher James | $60,000 |
Source: Public Records
Tax History
| Year | Tax Paid | Tax Assessment Tax Assessment Total Assessment is a certain percentage of the fair market value that is determined by local assessors to be the total taxable value of land and additions on the property. | Land | Improvement |
|---|---|---|---|---|
| 2025 | $5,316 | $132,862 | $101,317 | $31,545 |
| 2024 | $5,316 | $130,258 | $99,331 | $30,927 |
| 2023 | $5,192 | $127,705 | $97,384 | $30,321 |
| 2022 | $2,556 | $125,202 | $95,475 | $29,727 |
| 2021 | $1,514 | $122,748 | $93,603 | $29,145 |
| 2020 | $1,493 | $121,491 | $92,644 | $28,847 |
| 2019 | $1,465 | $119,110 | $90,828 | $28,282 |
| 2018 | $1,426 | $116,776 | $89,048 | $27,728 |
| 2017 | $1,400 | $114,487 | $87,302 | $27,185 |
| 2016 | $1,333 | $112,243 | $85,591 | $26,652 |
| 2015 | $1,310 | $110,558 | $84,306 | $26,252 |
| 2014 | $1,289 | $108,393 | $82,655 | $25,738 |
Source: Public Records
Map
Nearby Homes
- 8598 New Valley Way
- 8908 Liscarney Way
- 8775 Liscarney Way
- 8329 New Hills Ct
- 8794 Frosses Ct
- 8809 Coral Berry Way
- 8859 Shasta Lily Dr
- 8559 Zinnia Way
- 8724 Kentshire Way
- 8575 Black Kite Dr
- 8212 Newbury Park Ct
- 8592 Mystras Cir
- 8880 Inisheer Way
- 8216 Exbourne Cir
- 8233 Short Rd
- 8495 Zinnia Way
- 8163 Morgan Hill Way
- 8239 Derbyshire Cir
- 8613 Aviary Woods Way
- 8775 Brittany Park Dr
- 8686 Calvine Rd
- 8686 Calvine Rd
- 8673 Golden Sage Dr
- 8669 Golden Sage Dr
- 8763 Ardith Dr
- 8767 Ardith Dr
- 8665 Golden Sage Dr
- 8771 Ardith Dr
- 8661 Golden Sage Dr
- 8775 Ardith Dr
- 8672 Golden Sage Dr
- 8779 Ardith Dr
- 8657 Golden Sage Dr
- 8668 Golden Sage Dr
- 8664 Golden Sage Dr
- 8783 Ardith Dr
- 8764 Ardith Dr
- 8653 Golden Sage Dr
- 8770 Ardith Dr
- 8660 Golden Sage Dr
Your Personal Tour Guide
Ask me questions while you tour the home.