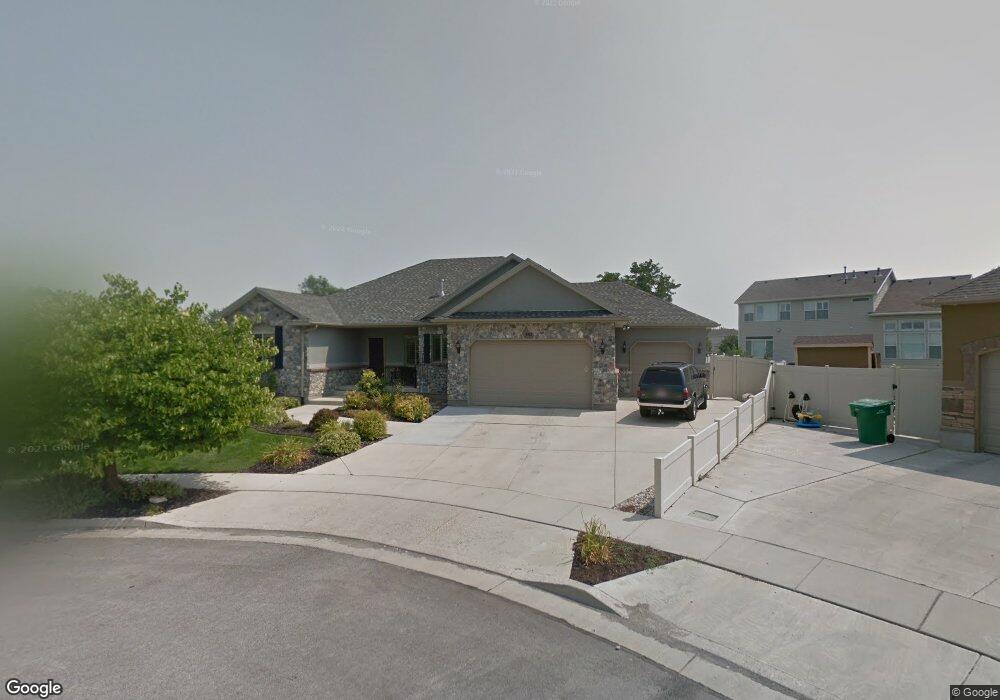
8693 S Cajean Cir West Jordan, UT 84088
Estimated Value: $780,000 - $865,727
4
Beds
5
Baths
4,053
Sq Ft
$204/Sq Ft
Est. Value
About This Home
This home is located at 8693 S Cajean Cir, West Jordan, UT 84088 and is currently estimated at $827,932, approximately $204 per square foot. 8693 S Cajean Cir is a home located in Salt Lake County with nearby schools including Westvale Elementary School, West Jordan Middle School, and West Jordan High School.
Ownership History
Date
Name
Owned For
Owner Type
Purchase Details
Closed on
Mar 27, 2020
Sold by
Black Scott Franklin and Black Kathy Lynn
Bought by
Black Scott F and Black Kathy L
Current Estimated Value
Home Financials for this Owner
Home Financials are based on the most recent Mortgage that was taken out on this home.
Original Mortgage
$171,500
Outstanding Balance
$118,523
Interest Rate
3.1%
Mortgage Type
New Conventional
Estimated Equity
$709,409
Purchase Details
Closed on
May 9, 2012
Sold by
Kelly Larry A and Kelly Janis G
Bought by
Heckman Joseph M and Heckman Pamela
Home Financials for this Owner
Home Financials are based on the most recent Mortgage that was taken out on this home.
Original Mortgage
$292,800
Interest Rate
3.94%
Mortgage Type
New Conventional
Purchase Details
Closed on
Dec 23, 2003
Sold by
Cajean Estates Llc
Bought by
Kelly Larry A and Kelly Janis G
Create a Home Valuation Report for This Property
The Home Valuation Report is an in-depth analysis detailing your home's value as well as a comparison with similar homes in the area
Home Values in the Area
Average Home Value in this Area
Purchase History
| Date | Buyer | Sale Price | Title Company |
|---|---|---|---|
| Black Scott F | -- | Backman Title Services | |
| Black Scott Franklin | -- | Backman Title Services | |
| Black Scott F | -- | None Available | |
| Heckman Joseph M | -- | North American Title Llc | |
| Kelly Larry A | -- | Merrill Title |
Source: Public Records
Mortgage History
| Date | Status | Borrower | Loan Amount |
|---|---|---|---|
| Open | Black Scott Franklin | $171,500 | |
| Closed | Heckman Joseph M | $292,800 |
Source: Public Records
Tax History Compared to Growth
Tax History
| Year | Tax Paid | Tax Assessment Tax Assessment Total Assessment is a certain percentage of the fair market value that is determined by local assessors to be the total taxable value of land and additions on the property. | Land | Improvement |
|---|---|---|---|---|
| 2025 | $4,150 | $850,700 | $191,900 | $658,800 |
| 2024 | $4,150 | $798,400 | $177,000 | $621,400 |
| 2023 | $4,217 | $764,700 | $167,000 | $597,700 |
| 2022 | $4,377 | $780,900 | $163,700 | $617,200 |
| 2021 | $3,719 | $604,000 | $132,000 | $472,000 |
| 2020 | $3,521 | $536,600 | $132,000 | $404,600 |
| 2019 | $3,461 | $517,300 | $132,000 | $385,300 |
| 2018 | $3,306 | $490,100 | $96,800 | $393,300 |
| 2017 | $3,143 | $463,800 | $96,800 | $367,000 |
| 2016 | $3,162 | $438,400 | $96,800 | $341,600 |
| 2015 | $3,124 | $422,300 | $101,400 | $320,900 |
| 2014 | $2,914 | $387,800 | $94,000 | $293,800 |
Source: Public Records
Map
Nearby Homes
- 1773 W 8760 S
- 2041 W 8820 S
- 1633 W Rockaway Ln
- 8534 S Redwood Rd
- 8859 S Long Dr
- 8518 S Redwood Rd
- 8510 S Redwood Rd
- 8383 S 2200 W
- 1636 Plum Creek Dr
- 1424 Stone Meadow Dr
- 1434 Autumn Oak Cir
- 1689 W 8295 S Unit 2
- 1401 W Stone Meadow Dr
- 8461 S 2385 W
- 1352 W 8780 S
- 77 Rio Bravo Place
- 14 San Miguel St
- 8686 S Temple Dr
- 1968 W 9270 S Unit C
- 2223 W Williamsburg Cir
- 8687 S Cajean Cir
- 1858 W 8740 S
- 8694 S Cajean Cir
- 1878 W 8740 S
- 1894 W 8740 S
- 8688 S Cajean Cir
- 8733 S 1850 W
- 8697 S 1980 W
- 1908 W 8740 S
- 8689 S 1980 W
- 8748 S 1850 W
- 1937 Cajean Way
- 1884 W Cajean Way
- 1842 W 8760 S
- 1896 Cajean Way
- 8749 S 1900 W
- 1908 Cajean Way
- 1822 W 8760 S
- 8764 S 1850 W
- 8763 S 1900 W