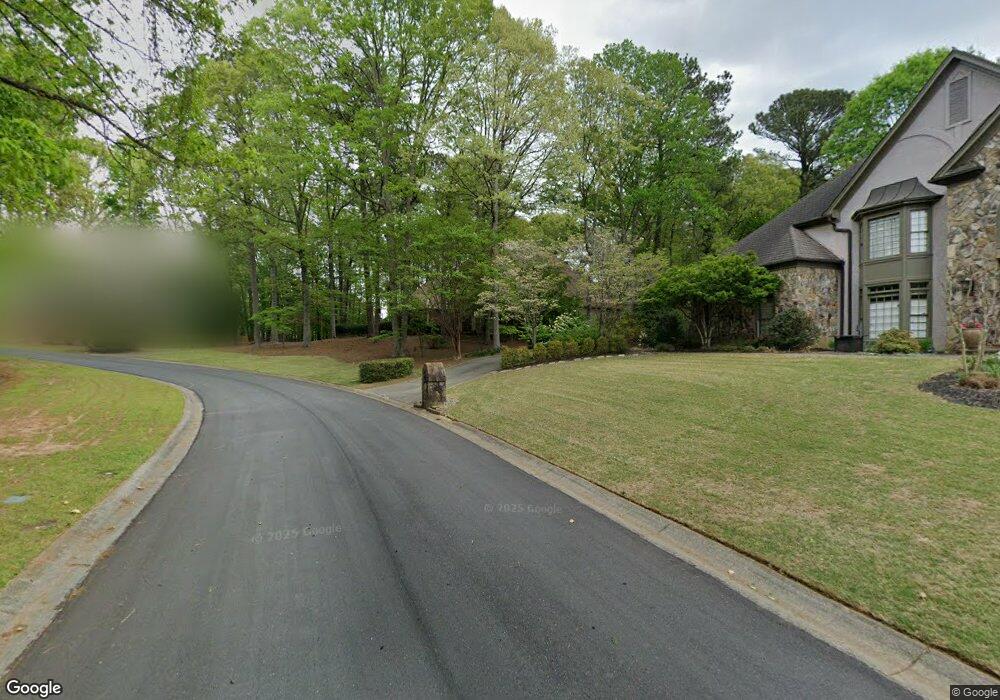
8695 River Trace Roswell, GA 30076
Horseshoe Bend NeighborhoodEstimated Value: $1,028,869 - $1,208,000
4
Beds
5
Baths
4,738
Sq Ft
$232/Sq Ft
Est. Value
About This Home
This home is located at 8695 River Trace, Roswell, GA 30076 and is currently estimated at $1,099,967, approximately $232 per square foot. 8695 River Trace is a home located in Fulton County with nearby schools including River Eves Elementary School, Holcomb Bridge Middle School, and Centennial High School.
Ownership History
Date
Name
Owned For
Owner Type
Purchase Details
Closed on
Jan 15, 1998
Sold by
Boteler Jenny B
Bought by
Boteler Richard H
Current Estimated Value
Home Financials for this Owner
Home Financials are based on the most recent Mortgage that was taken out on this home.
Original Mortgage
$370,800
Outstanding Balance
$62,821
Interest Rate
6.87%
Mortgage Type
New Conventional
Estimated Equity
$1,037,146
Purchase Details
Closed on
May 8, 1995
Sold by
Mccook Barry C Lisa Y
Bought by
Boteler Richard H Jenn
Purchase Details
Closed on
Aug 25, 1993
Sold by
Boyce Glenn W Gail H
Bought by
Mccook Barry C Lisa Y
Home Financials for this Owner
Home Financials are based on the most recent Mortgage that was taken out on this home.
Original Mortgage
$379,800
Interest Rate
4%
Create a Home Valuation Report for This Property
The Home Valuation Report is an in-depth analysis detailing your home's value as well as a comparison with similar homes in the area
Home Values in the Area
Average Home Value in this Area
Purchase History
| Date | Buyer | Sale Price | Title Company |
|---|---|---|---|
| Boteler Richard H | $1,000 | -- | |
| Boteler Richard H Jenn | $405,000 | -- | |
| Mccook Barry C Lisa Y | $422,000 | -- |
Source: Public Records
Mortgage History
| Date | Status | Borrower | Loan Amount |
|---|---|---|---|
| Open | Boteler Richard H | $370,800 | |
| Previous Owner | Mccook Barry C Lisa Y | $379,800 | |
| Closed | Boteler Richard H Jenn | $0 |
Source: Public Records
Tax History
| Year | Tax Paid | Tax Assessment Tax Assessment Total Assessment is a certain percentage of the fair market value that is determined by local assessors to be the total taxable value of land and additions on the property. | Land | Improvement |
|---|---|---|---|---|
| 2025 | $1,270 | $317,440 | $82,240 | $235,200 |
| 2023 | $10,725 | $379,960 | $118,160 | $261,800 |
| 2022 | $2,796 | $295,200 | $55,200 | $240,000 |
| 2021 | $3,737 | $264,040 | $60,880 | $203,160 |
| 2020 | $3,770 | $260,880 | $60,160 | $200,720 |
| 2019 | $1,023 | $256,320 | $59,120 | $197,200 |
| 2018 | $6,704 | $250,280 | $57,720 | $192,560 |
| 2017 | $5,354 | $195,440 | $45,960 | $149,480 |
| 2016 | $5,353 | $195,440 | $45,960 | $149,480 |
| 2015 | $6,441 | $195,440 | $45,960 | $149,480 |
| 2014 | $5,600 | $195,440 | $45,960 | $149,480 |
Source: Public Records
Map
Nearby Homes
- 8705 River Bluff Ln
- 510 Wayt Rd
- 325 Riverhall Ct Unit 5
- 420 Rivertrail Ct
- 300 Woodchuck Ct
- 7 Ninth Green Dr
- 155 Cartier Ct
- 413 Sassafras Rd
- 420 Hackberry Ct Unit 1
- 8980 Stonelake Ct
- 2075 River Falls Dr
- 555 S Riversong Ln
- 350 Riversong Way
- 425 Hackberry Ln
- 250 Shadowledge Ln
- 135 Lazy Laurel Chase
- 3020 Kara Ct
- 3209 Canyon Point Cir
- 3010 Kara Ct
- 2705 Holcomb Springs Dr
- 8685 River Trace
- 8685 River Trace Unit 23
- 165 Steeple Gate Ln
- 405 Lofty Ln
- 160 Steeple Gate Ln
- 8690 River Trce
- 8715 River Trace
- 415 Lofty Ln
- 8675 River Trace
- 400 Lofty Ln
- 150 Steeple Gate Ln
- 8675 Steeple Chase Dr Unit 1
- 8680 River Trace
- 410 Lofty Ln
- 155 Steeple Gate Ln
- 8700 River Trace
- 425 Lofty Ln
- 145 Steeple Gate Ln
- 420 Lofty Ln
- 8725 River Trace
Your Personal Tour Guide
Ask me questions while you tour the home.