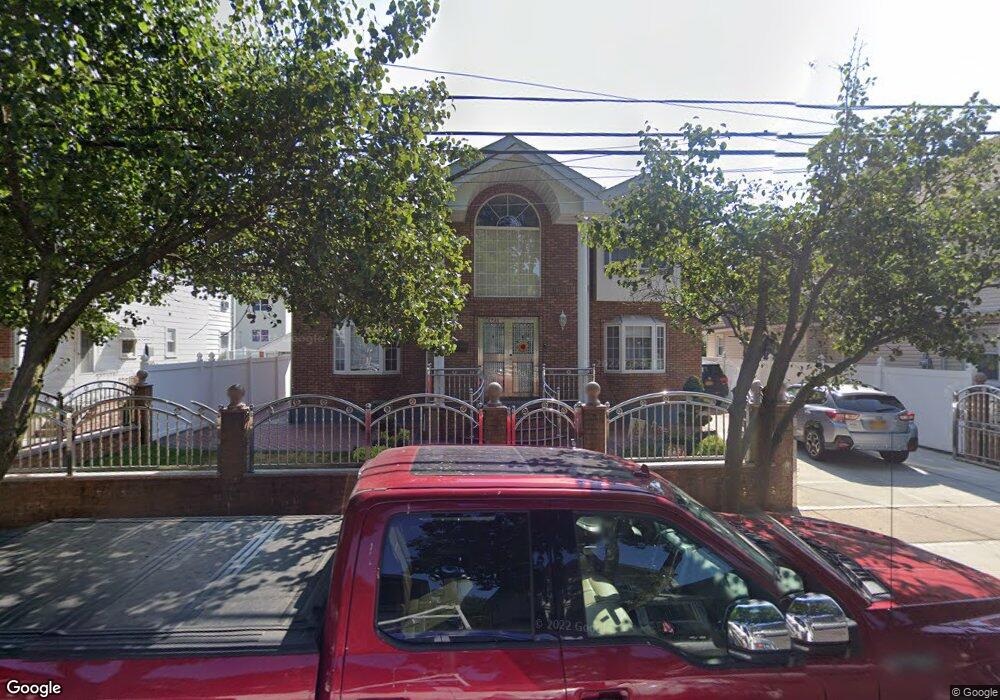
87-85 256th St Floral Park, NY 11001
Estimated Value: $1,329,000 - $1,886,000
6
Beds
6
Baths
2,800
Sq Ft
$603/Sq Ft
Est. Value
About This Home
This home is located at 87-85 256th St, Floral Park, NY 11001 and is currently estimated at $1,687,835, approximately $602 per square foot. 87-85 256th St is a home located in Queens County with nearby schools including P.S. 191 Mayflower School, Irwin Altman Middle School 172, and Martin Van Buren High School.
Ownership History
Date
Name
Owned For
Owner Type
Purchase Details
Closed on
Aug 29, 2024
Sold by
Paredes Evelyn
Bought by
Paredes Evelyn and Paredes Nelson
Current Estimated Value
Purchase Details
Closed on
Jul 28, 2015
Sold by
Singh Balbir
Bought by
Paredes Evelyn
Purchase Details
Closed on
May 10, 2007
Sold by
Diblasi Joseph
Bought by
Singh Balbir
Home Financials for this Owner
Home Financials are based on the most recent Mortgage that was taken out on this home.
Original Mortgage
$417,000
Interest Rate
6.27%
Mortgage Type
Purchase Money Mortgage
Purchase Details
Closed on
Oct 31, 2001
Sold by
Wain Charles
Bought by
Diblasi Joseph
Home Financials for this Owner
Home Financials are based on the most recent Mortgage that was taken out on this home.
Original Mortgage
$256,000
Interest Rate
6.67%
Mortgage Type
Purchase Money Mortgage
Purchase Details
Closed on
Jul 9, 2001
Sold by
Andrews Emma Wain and Wain Charles
Bought by
Wain Charles
Create a Home Valuation Report for This Property
The Home Valuation Report is an in-depth analysis detailing your home's value as well as a comparison with similar homes in the area
Home Values in the Area
Average Home Value in this Area
Purchase History
| Date | Buyer | Sale Price | Title Company |
|---|---|---|---|
| Paredes Evelyn | -- | -- | |
| Paredes Evelyn | $989,500 | -- | |
| Paredes Evelyn | $989,500 | -- | |
| Singh Balbir | $527,600 | -- | |
| Singh Balbir | $527,600 | -- | |
| Diblasi Joseph | -- | -- | |
| Diblasi Joseph | -- | -- | |
| Wain Charles | -- | -- | |
| Wain Charles | -- | -- |
Source: Public Records
Mortgage History
| Date | Status | Borrower | Loan Amount |
|---|---|---|---|
| Previous Owner | Singh Balbir | $417,000 | |
| Previous Owner | Diblasi Joseph | $256,000 |
Source: Public Records
Tax History Compared to Growth
Tax History
| Year | Tax Paid | Tax Assessment Tax Assessment Total Assessment is a certain percentage of the fair market value that is determined by local assessors to be the total taxable value of land and additions on the property. | Land | Improvement |
|---|---|---|---|---|
| 2025 | $10,690 | $56,414 | $18,500 | $37,914 |
| 2024 | $10,673 | $53,222 | $20,918 | $32,304 |
| 2023 | $10,673 | $53,138 | $19,233 | $33,905 |
| 2022 | $10,545 | $68,880 | $29,100 | $39,780 |
| 2021 | $10,487 | $73,680 | $29,100 | $44,580 |
| 2020 | $9,951 | $81,000 | $29,100 | $51,900 |
| 2019 | $9,278 | $84,660 | $29,100 | $55,560 |
| 2018 | $9,027 | $44,282 | $19,023 | $25,259 |
| 2017 | $8,973 | $44,018 | $23,774 | $20,244 |
| 2016 | $8,302 | $44,018 | $23,774 | $20,244 |
| 2015 | $5,039 | $39,177 | $28,574 | $10,603 |
| 2014 | $5,039 | $36,960 | $32,340 | $4,620 |
Source: Public Records
Map
Nearby Homes
- 256-12 87th Rd
- 87-47 256th St
- 29 Brokaw Ave
- 55 Tulip Ave Unit 6-3
- 8762 Little Neck Pkwy
- 254-20 87th Rd
- 8732 258th St
- 5 Adelaide St Unit B1 D2
- 5 Adelaide St Unit B2D1
- 91 Tulip Ave Unit G C2
- 91 Tulip Ave Unit 2
- 91 Tulip Ave Unit B2
- 91 Tulip Ave Unit E1
- 87-15 258th St
- 8771 253rd St
- 258-09 87th Ave
- 14 Flower Ave
- 8748 252nd St
- 78 Ontario Rd
- 1 Childs Ave Unit 1E
- 87-95 256th St
- 8795 256th St
- 8789 256th St
- 87-89 256th St
- 8785 256th St
- 8792 256th St
- 8790 256th St
- 8794 257th St
- 8786 256th St
- 8790 257th St
- 8796 256th St
- 8781 256th St
- 8790 257th St
- 8790 257th St
- 8786 257th St
- 87-86 257th St
- 8784 256th St
- 25601 Jericho Turnpike
- 25547 Jericho Turnpike
- 25547 Jericho Turnpike