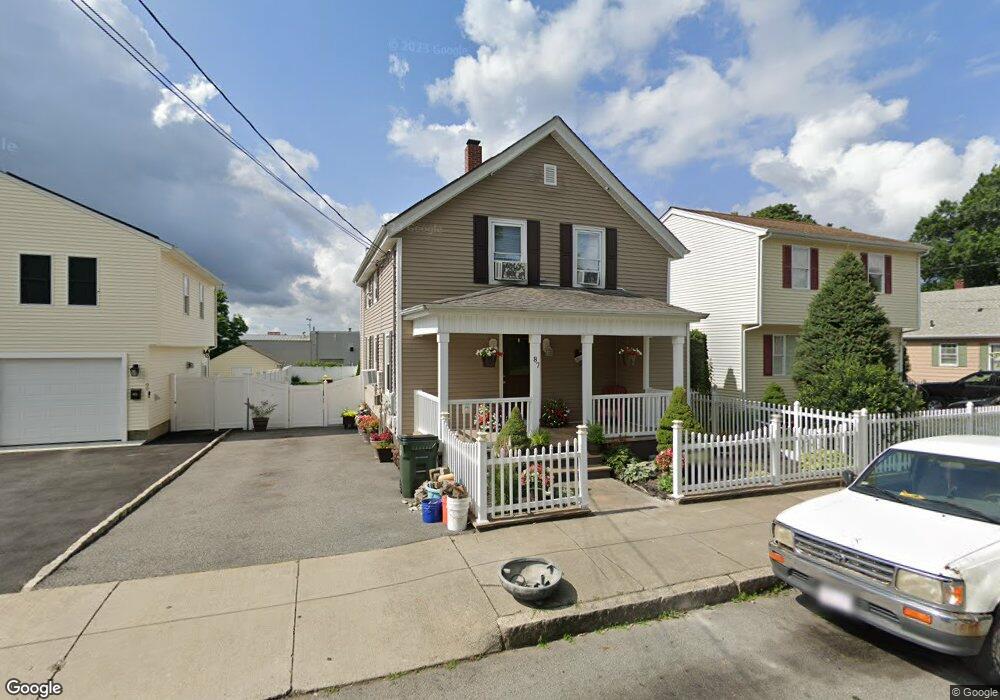
87 Anthony St Unit 1 Fall River, MA 02721
Maplewood NeighborhoodEstimated Value: $419,000 - $551,000
3
Beds
3
Baths
1,903
Sq Ft
$240/Sq Ft
Est. Value
About This Home
This home is located at 87 Anthony St Unit 1, Fall River, MA 02721 and is currently estimated at $456,808, approximately $240 per square foot. 87 Anthony St Unit 1 is a home located in Bristol County with nearby schools including Letourneau Elementary School, Matthew J. Kuss Middle School, and B M C Durfee High School.
Ownership History
Date
Name
Owned For
Owner Type
Purchase Details
Closed on
Aug 10, 2007
Sold by
Molina Darlene and Gallant Steven
Bought by
Botelho Elsa F and Botelho John
Current Estimated Value
Home Financials for this Owner
Home Financials are based on the most recent Mortgage that was taken out on this home.
Original Mortgage
$225,000
Outstanding Balance
$141,582
Interest Rate
6.72%
Mortgage Type
Purchase Money Mortgage
Estimated Equity
$315,226
Purchase Details
Closed on
Aug 30, 1999
Sold by
Heffernan-Corbett T
Bought by
Gallant Steven
Create a Home Valuation Report for This Property
The Home Valuation Report is an in-depth analysis detailing your home's value as well as a comparison with similar homes in the area
Home Values in the Area
Average Home Value in this Area
Purchase History
| Date | Buyer | Sale Price | Title Company |
|---|---|---|---|
| Botelho Elsa F | $225,000 | -- | |
| Gallant Steven | $80,000 | -- |
Source: Public Records
Mortgage History
| Date | Status | Borrower | Loan Amount |
|---|---|---|---|
| Open | Botelho Elsa F | $225,000 | |
| Previous Owner | Gallant Steven | $39,500 | |
| Previous Owner | Gallant Steven | $235,900 |
Source: Public Records
Tax History
| Year | Tax Paid | Tax Assessment Tax Assessment Total Assessment is a certain percentage of the fair market value that is determined by local assessors to be the total taxable value of land and additions on the property. | Land | Improvement |
|---|---|---|---|---|
| 2025 | $4,234 | $369,800 | $124,200 | $245,600 |
| 2024 | $3,981 | $346,500 | $119,500 | $227,000 |
| 2023 | $3,740 | $304,800 | $102,400 | $202,400 |
| 2022 | $3,218 | $273,500 | $93,100 | $180,400 |
| 2021 | $3,218 | $232,700 | $86,100 | $146,600 |
| 2020 | $3,217 | $222,600 | $82,400 | $140,200 |
| 2019 | $3,082 | $211,400 | $78,500 | $132,900 |
| 2018 | $2,823 | $193,100 | $77,100 | $116,000 |
| 2017 | $2,710 | $193,600 | $78,600 | $115,000 |
| 2016 | $2,434 | $178,600 | $81,900 | $96,700 |
| 2015 | $2,297 | $175,600 | $78,800 | $96,800 |
| 2014 | $2,262 | $179,800 | $83,000 | $96,800 |
Source: Public Records
Map
Nearby Homes
Your Personal Tour Guide
Ask me questions while you tour the home.