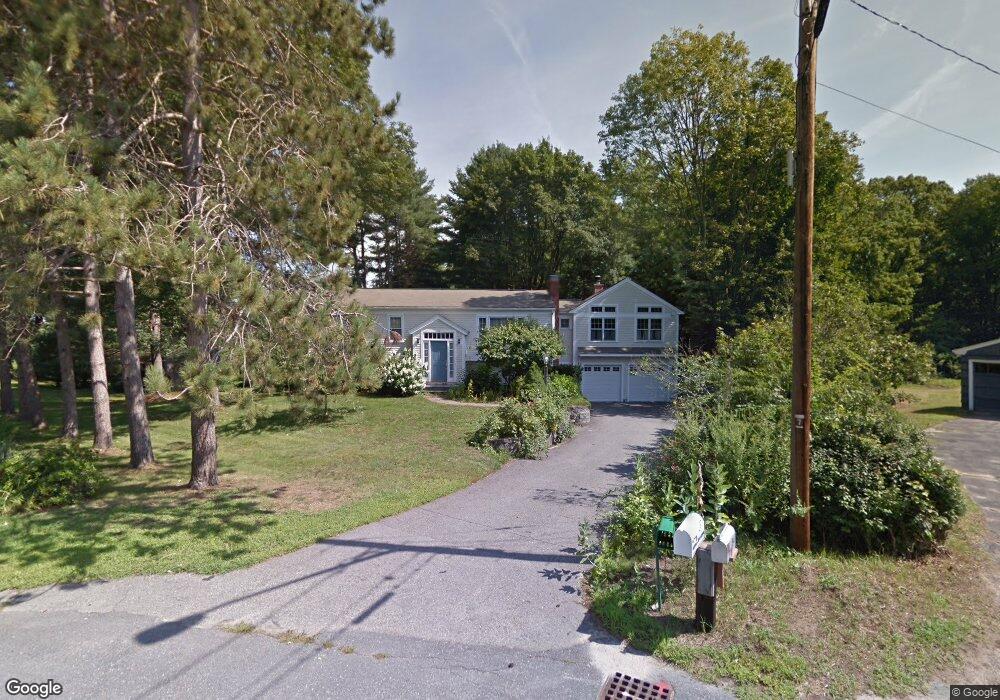
87 Bruce Rd Concord, MA 01742
Estimated Value: $1,368,000 - $1,563,000
4
Beds
3
Baths
2,197
Sq Ft
$670/Sq Ft
Est. Value
About This Home
This home is located at 87 Bruce Rd, Concord, MA 01742 and is currently estimated at $1,471,714, approximately $669 per square foot. 87 Bruce Rd is a home located in Middlesex County with nearby schools including Willard School, Concord Middle School, and Concord Carlisle High School.
Ownership History
Date
Name
Owned For
Owner Type
Purchase Details
Closed on
Dec 23, 2020
Sold by
Oliver Michael A and Oliver Carol K
Bought by
Oliver Nt and Oliver
Current Estimated Value
Home Financials for this Owner
Home Financials are based on the most recent Mortgage that was taken out on this home.
Original Mortgage
$350,100
Interest Rate
2.7%
Mortgage Type
New Conventional
Purchase Details
Closed on
Apr 6, 2015
Sold by
Oliver Carol K
Bought by
Oliver Nt and Oliver
Create a Home Valuation Report for This Property
The Home Valuation Report is an in-depth analysis detailing your home's value as well as a comparison with similar homes in the area
Home Values in the Area
Average Home Value in this Area
Purchase History
| Date | Buyer | Sale Price | Title Company |
|---|---|---|---|
| Oliver Nt | -- | None Available | |
| Oliver Michael A | -- | None Available | |
| Oliver Nt | -- | -- |
Source: Public Records
Mortgage History
| Date | Status | Borrower | Loan Amount |
|---|---|---|---|
| Previous Owner | Oliver Michael A | $350,100 |
Source: Public Records
Tax History
| Year | Tax Paid | Tax Assessment Tax Assessment Total Assessment is a certain percentage of the fair market value that is determined by local assessors to be the total taxable value of land and additions on the property. | Land | Improvement |
|---|---|---|---|---|
| 2025 | $162 | $1,221,200 | $643,000 | $578,200 |
| 2024 | $15,412 | $1,173,800 | $643,000 | $530,800 |
| 2023 | $14,453 | $1,115,200 | $584,400 | $530,800 |
| 2022 | $13,336 | $903,500 | $467,400 | $436,100 |
| 2021 | $13,302 | $903,700 | $467,400 | $436,300 |
| 2020 | $12,623 | $887,100 | $467,400 | $419,700 |
| 2019 | $12,203 | $860,000 | $453,800 | $406,200 |
| 2018 | $11,912 | $833,600 | $432,100 | $401,500 |
| 2017 | $11,231 | $798,200 | $411,500 | $386,700 |
| 2016 | $11,466 | $823,700 | $411,500 | $412,200 |
| 2015 | $10,732 | $751,000 | $381,000 | $370,000 |
Source: Public Records
Map
Nearby Homes
- 165 Everett St
- 381 Thoreau St
- 236 Fairhaven Rd
- 143 Everett St
- 150 Hubbard St Unit B
- 25 Fairhaven Rd
- 181 Stow St
- 22 Belknap Ct
- 61B Walden St
- 34 Thoreau St
- 34 Thoreau St Unit 34
- 32 Thoreau St Unit 32
- 46 Sudbury Rd
- 265 Elsinore St
- 105 Lexington Rd
- 59 Elm St
- 106 Elm St
- 49 Willard Common
- 29 Willard Common
- 212 Hawthorne Ln
Your Personal Tour Guide
Ask me questions while you tour the home.