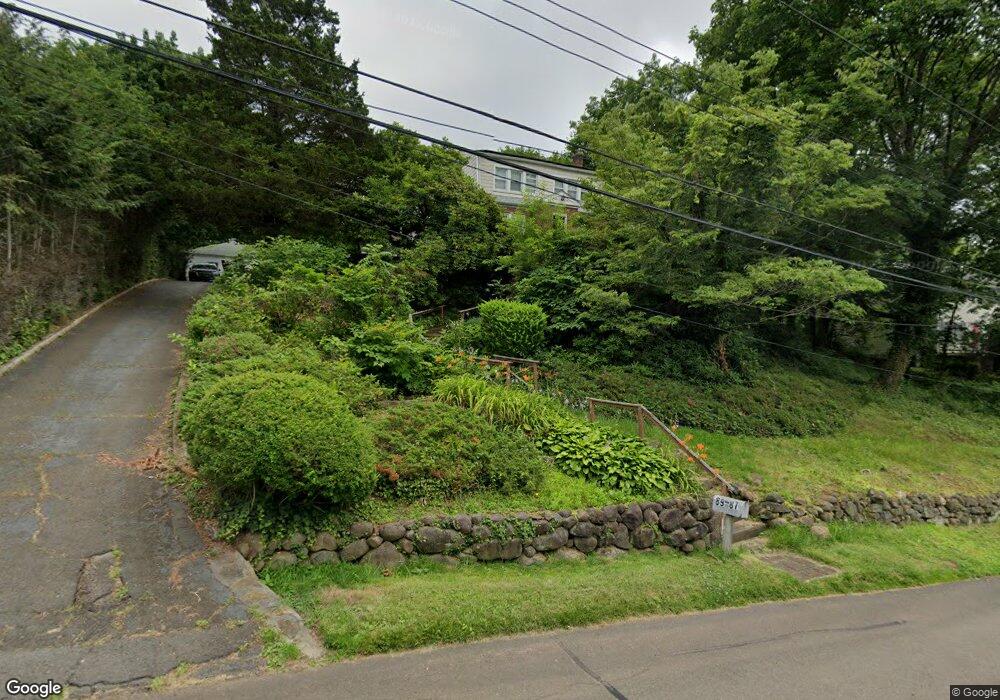
87 Colony St Hamden, CT 06518
Estimated Value: $465,000 - $521,000
4
Beds
3
Baths
2,486
Sq Ft
$199/Sq Ft
Est. Value
About This Home
This home is located at 87 Colony St, Hamden, CT 06518 and is currently estimated at $495,362, approximately $199 per square foot. 87 Colony St is a home located in New Haven County with nearby schools including Hamden Middle School, Hamden High School, and Alphabet Academy - Hamden North Campus.
Ownership History
Date
Name
Owned For
Owner Type
Purchase Details
Closed on
Jul 1, 2010
Sold by
Penna Christopher P and Penna Robin L
Bought by
Allen Shona
Current Estimated Value
Home Financials for this Owner
Home Financials are based on the most recent Mortgage that was taken out on this home.
Original Mortgage
$309,817
Outstanding Balance
$209,810
Interest Rate
5.5%
Mortgage Type
FHA
Estimated Equity
$285,552
Purchase Details
Closed on
Jul 18, 2006
Sold by
Penna Thomas R and Penna Josephine M
Bought by
Penna Christopher P and Penna Robin L
Home Financials for this Owner
Home Financials are based on the most recent Mortgage that was taken out on this home.
Original Mortgage
$260,000
Interest Rate
6.71%
Purchase Details
Closed on
Oct 27, 1987
Sold by
Denicola Esther A
Bought by
Penna Thomas A
Create a Home Valuation Report for This Property
The Home Valuation Report is an in-depth analysis detailing your home's value as well as a comparison with similar homes in the area
Home Values in the Area
Average Home Value in this Area
Purchase History
| Date | Buyer | Sale Price | Title Company |
|---|---|---|---|
| Allen Shona | $314,000 | -- | |
| Penna Christopher P | $390,000 | -- | |
| Penna Thomas A | $90,000 | -- |
Source: Public Records
Mortgage History
| Date | Status | Borrower | Loan Amount |
|---|---|---|---|
| Open | Penna Thomas A | $309,817 | |
| Previous Owner | Penna Thomas A | $252,000 | |
| Previous Owner | Penna Thomas A | $260,000 |
Source: Public Records
Tax History
| Year | Tax Paid | Tax Assessment Tax Assessment Total Assessment is a certain percentage of the fair market value that is determined by local assessors to be the total taxable value of land and additions on the property. | Land | Improvement |
|---|---|---|---|---|
| 2025 | $15,656 | $301,770 | $74,480 | $227,290 |
| 2024 | $12,048 | $216,650 | $57,120 | $159,530 |
| 2023 | $12,183 | $216,090 | $57,120 | $158,970 |
| 2022 | $11,989 | $216,090 | $57,120 | $158,970 |
| 2021 | $11,332 | $216,090 | $57,120 | $158,970 |
| 2020 | $11,174 | $214,970 | $87,850 | $127,120 |
| 2019 | $10,999 | $225,120 | $87,850 | $137,270 |
| 2018 | $10,797 | $225,120 | $87,850 | $137,270 |
| 2017 | $10,189 | $225,120 | $87,850 | $137,270 |
| 2016 | $10,211 | $225,120 | $87,850 | $137,270 |
| 2015 | $9,295 | $227,430 | $89,460 | $137,970 |
| 2014 | $9,081 | $227,430 | $89,460 | $137,970 |
Source: Public Records
Map
Nearby Homes
- 114 Colony St
- 64 Evergreen Ave
- 51 Evergreen Ave
- 25 Hamden Hills Dr Unit 69
- 2831 Dixwell Ave
- 90 Colonial Dr
- 75 Colonial Dr
- 175 Mill Pond Rd Unit 346
- 175 Mill Pond Rd Unit 444
- 175 Mill Pond Rd Unit 214
- 175 Mill Pond Rd Unit 201
- 183 Centerbrook Rd
- 141 Worth Ave
- 178 Worth Ave
- 112 Worth Ave
- 142 Washington Ave
- 128 Shepards Knoll Dr Unit 128
- 275 Centerbrook Rd
- 72 Shepards Knoll Dr
- 240 Centerbrook Rd Unit 240
Your Personal Tour Guide
Ask me questions while you tour the home.