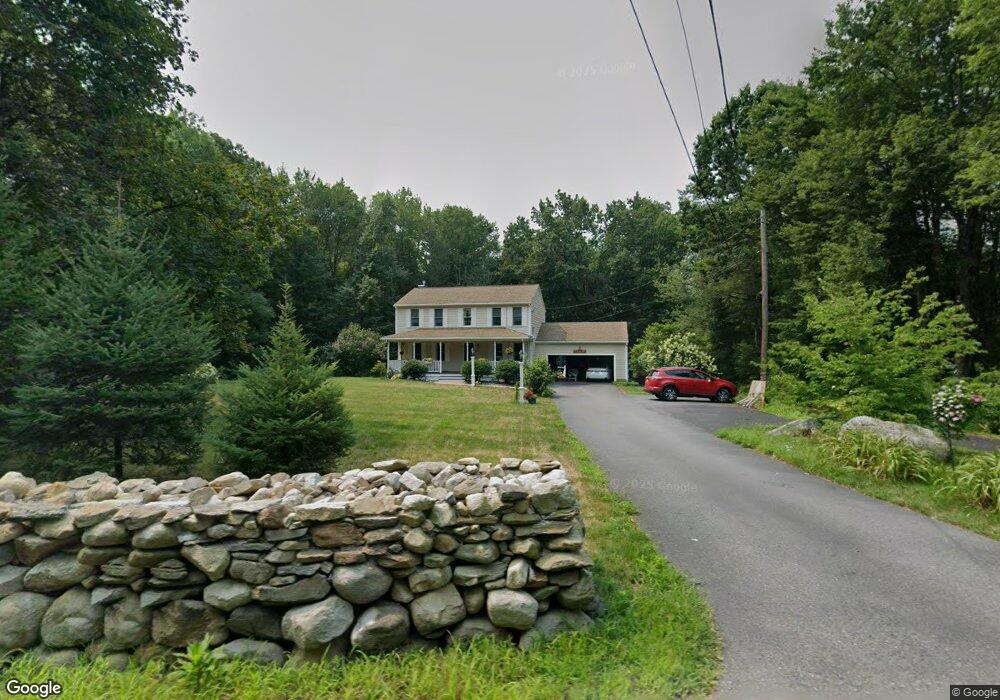
87 Concord Rd Westford, MA 01886
Estimated Value: $707,278 - $794,000
4
Beds
2
Baths
1,700
Sq Ft
$437/Sq Ft
Est. Value
About This Home
This home is located at 87 Concord Rd, Westford, MA 01886 and is currently estimated at $743,320, approximately $437 per square foot. 87 Concord Rd is a home located in Middlesex County with nearby schools including Col John Robinson, John A. Crisafulli Elementary School, and Blanchard Middle School.
Ownership History
Date
Name
Owned For
Owner Type
Purchase Details
Closed on
Nov 2, 2015
Sold by
Jones Alan L and Jones Margaret M
Bought by
Jones Ft and Jones Alan L
Current Estimated Value
Purchase Details
Closed on
Mar 1, 1979
Bought by
Jones Alan L and Jones Margaret M
Create a Home Valuation Report for This Property
The Home Valuation Report is an in-depth analysis detailing your home's value as well as a comparison with similar homes in the area
Home Values in the Area
Average Home Value in this Area
Purchase History
| Date | Buyer | Sale Price | Title Company |
|---|---|---|---|
| Jones Ft | -- | -- | |
| Jones Alan L | $66,900 | -- |
Source: Public Records
Mortgage History
| Date | Status | Borrower | Loan Amount |
|---|---|---|---|
| Previous Owner | Jones Alan L | $95,500 | |
| Previous Owner | Jones Alan L | $66,500 | |
| Previous Owner | Jones Alan L | $34,000 |
Source: Public Records
Tax History
| Year | Tax Paid | Tax Assessment Tax Assessment Total Assessment is a certain percentage of the fair market value that is determined by local assessors to be the total taxable value of land and additions on the property. | Land | Improvement |
|---|---|---|---|---|
| 2025 | $8,191 | $608,100 | $352,700 | $255,400 |
| 2024 | $8,010 | $581,700 | $336,000 | $245,700 |
| 2023 | $8,018 | $543,200 | $319,900 | $223,300 |
| 2022 | $7,923 | $491,500 | $272,900 | $218,600 |
| 2021 | $7,703 | $462,900 | $272,900 | $190,000 |
| 2020 | $7,585 | $464,500 | $272,900 | $191,600 |
| 2019 | $7,465 | $450,800 | $272,900 | $177,900 |
| 2018 | $7,082 | $437,700 | $262,800 | $174,900 |
| 2017 | $6,206 | $378,200 | $221,400 | $156,800 |
| 2016 | $6,189 | $379,700 | $221,400 | $158,300 |
| 2015 | $6,170 | $379,900 | $220,400 | $159,500 |
| 2014 | $6,102 | $367,600 | $211,700 | $155,900 |
Source: Public Records
Map
Nearby Homes
- 14 Hutchins Way
- 91 Jimney Dr Unit 91
- 18 Heather Dr
- 6 Colonel Rolls Dr
- 12 Patten Rd
- 44 Patten Rd
- 76 Beaver Brook Rd
- 82 Pleasant St
- 35 Forge Village Rd
- Lot 1 & 3 Beaver Brook Rd
- 2 Macquarrie Ln
- 14 Robinson Rd Unit 2
- 8 Bixby Ln
- 8 Boston Rd
- 59 Main St
- 62 Main St
- 20 Shattuck St
- 20 Bayberry Rd
- 25 Laurel Rd
- 71 Edsel Rd
Your Personal Tour Guide
Ask me questions while you tour the home.