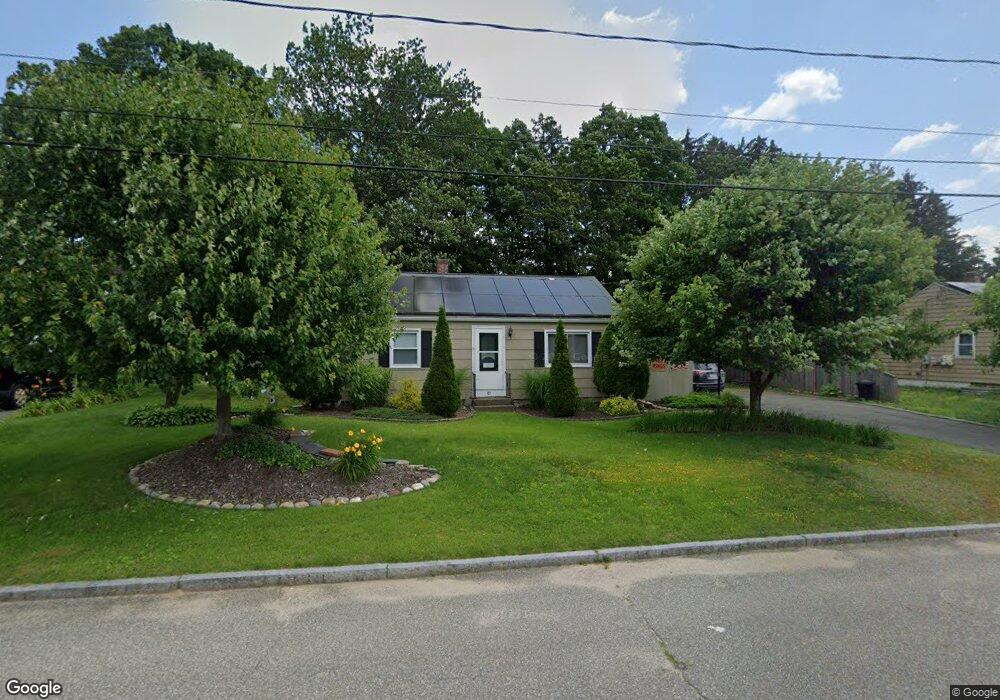
87 Denwall Dr Springfield, MA 01119
Sixteen Acres NeighborhoodEstimated Value: $250,000 - $270,000
2
Beds
1
Bath
768
Sq Ft
$343/Sq Ft
Est. Value
About This Home
This home is located at 87 Denwall Dr, Springfield, MA 01119 and is currently estimated at $263,169, approximately $342 per square foot. 87 Denwall Dr is a home located in Hampden County with nearby schools including Glickman Elementary, John J Duggan Middle, and Springfield High School of Science and Technology.
Ownership History
Date
Name
Owned For
Owner Type
Purchase Details
Closed on
Oct 6, 2006
Sold by
Thorning Ernest V and Loubier Nancy M
Bought by
Comstock Leon A
Current Estimated Value
Home Financials for this Owner
Home Financials are based on the most recent Mortgage that was taken out on this home.
Original Mortgage
$92,000
Outstanding Balance
$55,141
Interest Rate
6.54%
Mortgage Type
Purchase Money Mortgage
Estimated Equity
$208,028
Create a Home Valuation Report for This Property
The Home Valuation Report is an in-depth analysis detailing your home's value as well as a comparison with similar homes in the area
Home Values in the Area
Average Home Value in this Area
Purchase History
| Date | Buyer | Sale Price | Title Company |
|---|---|---|---|
| Comstock Leon A | $115,000 | -- |
Source: Public Records
Mortgage History
| Date | Status | Borrower | Loan Amount |
|---|---|---|---|
| Open | Comstock Leon A | $92,000 |
Source: Public Records
Tax History
| Year | Tax Paid | Tax Assessment Tax Assessment Total Assessment is a certain percentage of the fair market value that is determined by local assessors to be the total taxable value of land and additions on the property. | Land | Improvement |
|---|---|---|---|---|
| 2025 | $3,269 | $208,500 | $52,000 | $156,500 |
| 2024 | $3,090 | $192,400 | $52,000 | $140,400 |
| 2023 | $2,919 | $171,200 | $49,500 | $121,700 |
| 2022 | $2,979 | $158,300 | $49,500 | $108,800 |
| 2021 | $2,610 | $138,100 | $45,000 | $93,100 |
| 2020 | $2,556 | $130,900 | $45,000 | $85,900 |
| 2019 | $2,429 | $123,400 | $45,000 | $78,400 |
| 2018 | $2,450 | $124,500 | $45,000 | $79,500 |
| 2017 | $2,454 | $124,800 | $44,900 | $79,900 |
| 2016 | $2,395 | $121,800 | $44,900 | $76,900 |
| 2015 | $2,303 | $117,100 | $44,900 | $72,200 |
Source: Public Records
Map
Nearby Homes
Your Personal Tour Guide
Ask me questions while you tour the home.