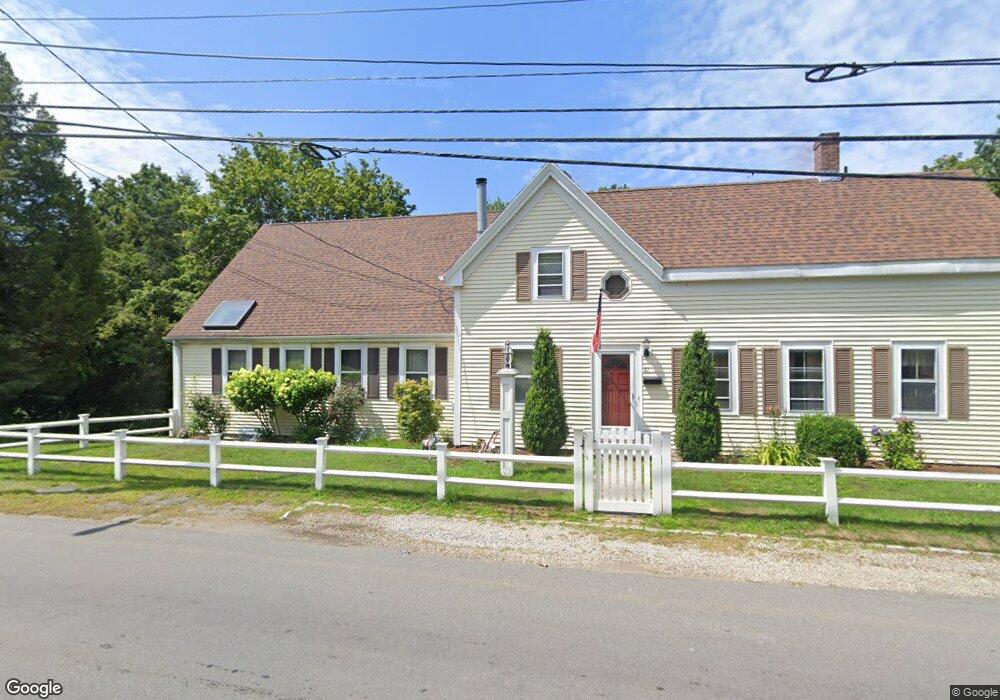
87 Elliot St Braintree, MA 02184
Weymouth Landing NeighborhoodEstimated Value: $796,000 - $982,000
5
Beds
5
Baths
2,386
Sq Ft
$367/Sq Ft
Est. Value
About This Home
This home is located at 87 Elliot St, Braintree, MA 02184 and is currently estimated at $875,822, approximately $367 per square foot. 87 Elliot St is a home located in Norfolk County with nearby schools including Sacred Heart Elementary School and South Shore Christian Academy.
Ownership History
Date
Name
Owned For
Owner Type
Purchase Details
Closed on
Jan 19, 2011
Sold by
Cresswell Scott D
Bought by
Keogh Michael C and Keogh Erin E
Current Estimated Value
Home Financials for this Owner
Home Financials are based on the most recent Mortgage that was taken out on this home.
Original Mortgage
$329,967
Outstanding Balance
$217,485
Interest Rate
4.25%
Mortgage Type
FHA
Estimated Equity
$658,337
Create a Home Valuation Report for This Property
The Home Valuation Report is an in-depth analysis detailing your home's value as well as a comparison with similar homes in the area
Home Values in the Area
Average Home Value in this Area
Purchase History
| Date | Buyer | Sale Price | Title Company |
|---|---|---|---|
| Keogh Michael C | $363,000 | -- |
Source: Public Records
Mortgage History
| Date | Status | Borrower | Loan Amount |
|---|---|---|---|
| Open | Keogh Michael C | $329,967 | |
| Previous Owner | Keogh Michael C | $135,000 | |
| Previous Owner | Keogh Michael C | $122,000 |
Source: Public Records
Tax History Compared to Growth
Tax History
| Year | Tax Paid | Tax Assessment Tax Assessment Total Assessment is a certain percentage of the fair market value that is determined by local assessors to be the total taxable value of land and additions on the property. | Land | Improvement |
|---|---|---|---|---|
| 2025 | $8,271 | $828,800 | $450,900 | $377,900 |
| 2024 | $7,493 | $790,400 | $420,400 | $370,000 |
| 2023 | $7,043 | $721,600 | $377,800 | $343,800 |
| 2022 | $6,816 | $685,000 | $341,200 | $343,800 |
| 2021 | $6,488 | $652,100 | $308,300 | $343,800 |
| 2020 | $5,913 | $599,700 | $280,300 | $319,400 |
| 2019 | $5,578 | $552,800 | $268,100 | $284,700 |
| 2018 | $5,441 | $516,200 | $243,700 | $272,500 |
| 2017 | $5,132 | $477,800 | $231,500 | $246,300 |
| 2016 | $4,560 | $415,300 | $195,000 | $220,300 |
| 2015 | $4,570 | $412,800 | $192,500 | $220,300 |
| 2014 | $4,301 | $376,600 | $175,500 | $201,100 |
Source: Public Records
Map
Nearby Homes
- 37 Lantern Ln
- 36 Brookside Rd
- 15 Summer St
- 51 Faxon St
- 122 Washington St Unit 22
- 141 Commercial St Unit 9
- 97 Liberty St
- 11 Richmond St
- 16 Lindbergh Ave
- 23-25 Lindbergh Ave
- 76 Kingman St
- 114 Broad St Unit D
- 114 Broad St Unit C
- 230 Lisle St
- 19 Vine St Unit 3
- 19 Vine St Unit 1
- 33 Congress St
- 24 Blake Rd
- 294 Commercial St
- 141 Hobart St
- 97 Elliot St
- 85 Sterling St
- 85 Sterling St Unit 1
- 107 Elliot St
- 70 Elliot St
- 67 Elliot St
- 14 Sterling Park
- 139 Stetson St
- 139-2 Stetson St
- 139-2 Stetson St Unit 2
- 139 Stetson St Unit 2
- 139 Stetson St
- 139 Stetson St Unit 1
- 22 Sterling Park
- 75 Sterling St Unit C
- 75 Sterling St
- 75 Sterling St Unit A & C
- 75 Sterling St Unit B
- 75 Sterling St Unit A
- 73 Sterling St Unit 1