Estimated Value: $1,602,563 - $2,134,000
4
Beds
3
Baths
3,303
Sq Ft
$573/Sq Ft
Est. Value
About This Home
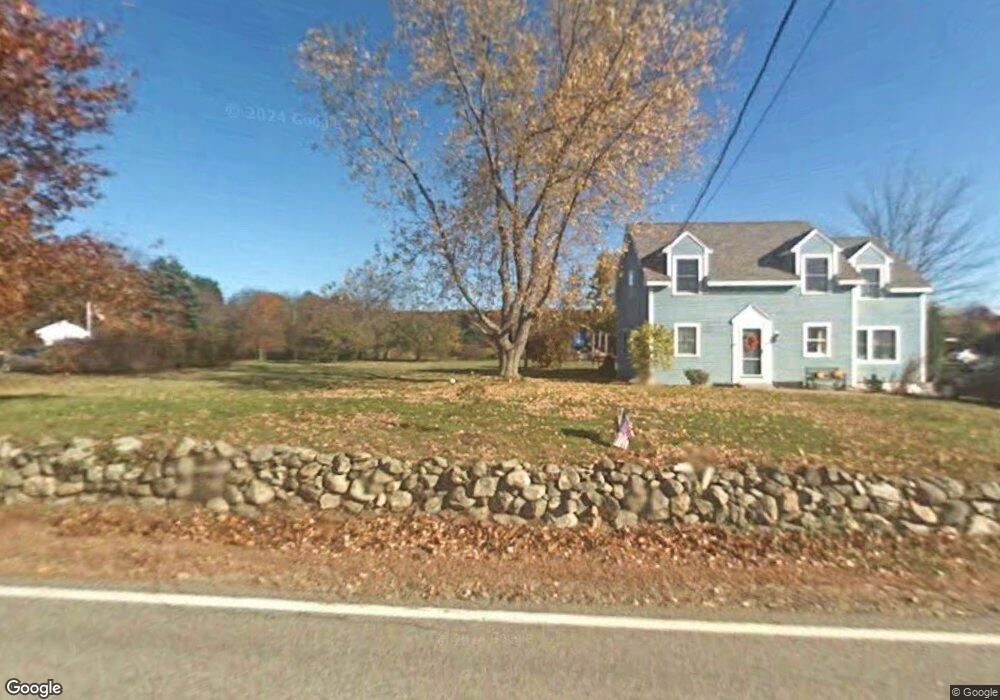
This home is located at 87 Grove Rd, Rye, NH 03870 and is currently estimated at $1,893,141, approximately $573 per square foot. 87 Grove Rd is a home located in Rockingham County with nearby schools including Rye Elementary School, Rye Junior High School, and Rye Country Day School.
Ownership History
Date
Name
Owned For
Owner Type
Purchase Details
Closed on
May 15, 2024
Sold by
Chi Gui X
Bought by
Zhang Danny
Current Estimated Value
Purchase Details
Closed on
Aug 11, 2011
Sold by
Nolin James P and Nolin Joanne M
Bought by
Zhang Danny and Chi Gui Zian
Purchase Details
Closed on
Sep 29, 2003
Sold by
Sonneborn Suzanne F
Bought by
Nolin James P and Nolin Joanne M
Create a Home Valuation Report for This Property
The Home Valuation Report is an in-depth analysis detailing your home's value as well as a comparison with similar homes in the area
Home Values in the Area
Average Home Value in this Area
Purchase History
| Date | Buyer | Sale Price | Title Company |
|---|---|---|---|
| Zhang Danny | -- | None Available | |
| Zhang Danny | -- | None Available | |
| Zhang Danny | -- | None Available | |
| Zhang Danny | $225,000 | -- | |
| Nolin James P | $100,000 | -- | |
| Zhang Danny | $225,000 | -- | |
| Nolin James P | $100,000 | -- |
Source: Public Records
Mortgage History
| Date | Status | Borrower | Loan Amount |
|---|---|---|---|
| Previous Owner | Nolin James P | $325,000 | |
| Previous Owner | Nolin James P | $325,000 | |
| Previous Owner | Nolin James P | $325,000 |
Source: Public Records
Tax History
| Year | Tax Paid | Tax Assessment Tax Assessment Total Assessment is a certain percentage of the fair market value that is determined by local assessors to be the total taxable value of land and additions on the property. | Land | Improvement |
|---|---|---|---|---|
| 2025 | $9,141 | $1,092,100 | $467,600 | $624,500 |
| 2024 | $9,458 | $1,092,100 | $467,600 | $624,500 |
| 2023 | $8,770 | $1,092,100 | $467,600 | $624,500 |
| 2022 | $7,623 | $1,092,100 | $467,600 | $624,500 |
| 2021 | $8,119 | $794,400 | $321,200 | $473,200 |
| 2020 | $8,119 | $794,400 | $321,200 | $473,200 |
| 2019 | $8,119 | $794,400 | $321,200 | $473,200 |
| 2018 | $8,031 | $794,400 | $321,200 | $473,200 |
| 2017 | $8,031 | $794,400 | $321,200 | $473,200 |
| 2016 | $7,774 | $727,900 | $233,800 | $494,100 |
| 2013 | $7,978 | $727,300 | $235,700 | $491,600 |
Source: Public Records
Map
Nearby Homes
Your Personal Tour Guide
Ask me questions while you tour the home.