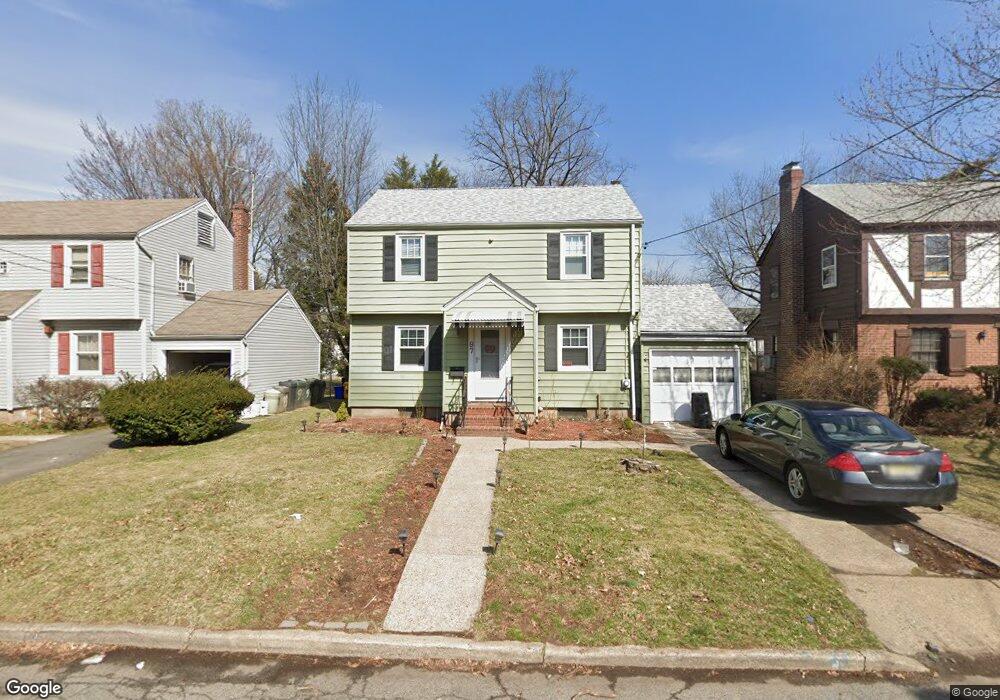
87 Jasper Ave Teaneck, NJ 07666
Estimated Value: $549,557 - $711,000
Studio
--
Bath
1,333
Sq Ft
$467/Sq Ft
Est. Value
About This Home
This home is located at 87 Jasper Ave, Teaneck, NJ 07666 and is currently estimated at $622,389, approximately $466 per square foot. 87 Jasper Ave is a home located in Bergen County with nearby schools including Teaneck Senior High School, Academy of Greatness & Excellence, and Bogota Middle School.
Ownership History
Date
Name
Owned For
Owner Type
Purchase Details
Closed on
Sep 16, 2013
Sold by
Brown Robert I
Bought by
Ponce Lucia E
Current Estimated Value
Home Financials for this Owner
Home Financials are based on the most recent Mortgage that was taken out on this home.
Original Mortgage
$252,000
Outstanding Balance
$189,382
Interest Rate
4.58%
Mortgage Type
New Conventional
Estimated Equity
$433,007
Create a Home Valuation Report for This Property
The Home Valuation Report is an in-depth analysis detailing your home's value as well as a comparison with similar homes in the area
Home Values in the Area
Average Home Value in this Area
Purchase History
| Date | Buyer | Sale Price | Title Company |
|---|---|---|---|
| Ponce Lucia E | $280,000 | -- |
Source: Public Records
Mortgage History
| Date | Status | Borrower | Loan Amount |
|---|---|---|---|
| Open | Ponce Lucia E | $252,000 |
Source: Public Records
Tax History
| Year | Tax Paid | Tax Assessment Tax Assessment Total Assessment is a certain percentage of the fair market value that is determined by local assessors to be the total taxable value of land and additions on the property. | Land | Improvement |
|---|---|---|---|---|
| 2025 | $9,664 | $442,500 | $265,000 | $177,500 |
| 2024 | $9,054 | $442,500 | $265,000 | $177,500 |
| 2023 | $8,876 | $274,200 | $172,500 | $101,700 |
| 2022 | $8,876 | $274,200 | $172,500 | $101,700 |
| 2021 | $8,928 | $274,200 | $172,500 | $101,700 |
| 2020 | $8,868 | $274,200 | $172,500 | $101,700 |
| 2019 | $8,664 | $271,000 | $172,500 | $98,500 |
| 2018 | $8,599 | $271,000 | $172,500 | $98,500 |
| 2017 | $8,518 | $271,000 | $172,500 | $98,500 |
| 2016 | $8,390 | $271,000 | $172,500 | $98,500 |
| 2015 | $8,257 | $271,000 | $172,500 | $98,500 |
| 2014 | $8,996 | $349,900 | $220,000 | $129,900 |
Source: Public Records
Map
Nearby Homes
- 57 Park Ave
- 44 Jasper Ave
- 20 Maple St
- 111 Teaneck Rd
- 71 Gordon St
- 82 Hazelton St
- 159 Sherwood Ave
- 238 Park Ave
- 203 Queen Anne Rd
- 50 Grand Ave
- 227 Beechwood Ave
- 203 Queen Anne Rd
- 196 Fort Lee Rd
- 114 Hackensack Ave
- 221 4th St
- 290 Queen Anne Rd
- 365 Rockledge Place
- 151 4th St
- 133 Degraw Ave
- 265 Main St Unit 704
Your Personal Tour Guide
Ask me questions while you tour the home.