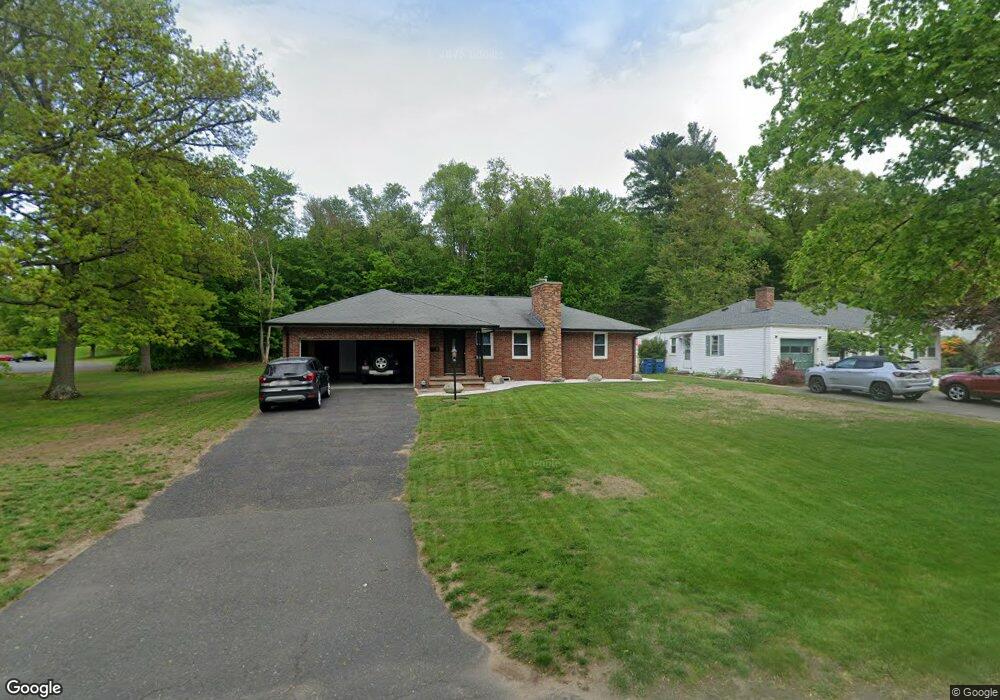
87 Laurel Rd West Springfield, MA 01089
Estimated Value: $332,780 - $365,000
3
Beds
1
Bath
1,321
Sq Ft
$263/Sq Ft
Est. Value
About This Home
This home is located at 87 Laurel Rd, West Springfield, MA 01089 and is currently estimated at $346,945, approximately $262 per square foot. 87 Laurel Rd is a home located in Hampden County with nearby schools including West Springfield High School and St Thomas The Apostle School.
Ownership History
Date
Name
Owned For
Owner Type
Purchase Details
Closed on
Jan 7, 2021
Sold by
Howe Christopher A and Howe Matthew R
Bought by
Howe Matthew R
Current Estimated Value
Purchase Details
Closed on
Nov 30, 1999
Sold by
Est Cicotte Joseph and Cicotte David A
Bought by
Howe Bruce A
Home Financials for this Owner
Home Financials are based on the most recent Mortgage that was taken out on this home.
Original Mortgage
$70,000
Interest Rate
7.77%
Mortgage Type
Purchase Money Mortgage
Create a Home Valuation Report for This Property
The Home Valuation Report is an in-depth analysis detailing your home's value as well as a comparison with similar homes in the area
Home Values in the Area
Average Home Value in this Area
Purchase History
| Date | Buyer | Sale Price | Title Company |
|---|---|---|---|
| Howe Matthew R | -- | None Available | |
| Howe Bruce A | $117,000 | -- |
Source: Public Records
Mortgage History
| Date | Status | Borrower | Loan Amount |
|---|---|---|---|
| Previous Owner | Howe Bruce A | $70,000 |
Source: Public Records
Tax History
| Year | Tax Paid | Tax Assessment Tax Assessment Total Assessment is a certain percentage of the fair market value that is determined by local assessors to be the total taxable value of land and additions on the property. | Land | Improvement |
|---|---|---|---|---|
| 2025 | $4,344 | $292,100 | $127,500 | $164,600 |
| 2024 | $4,287 | $289,500 | $127,500 | $162,000 |
| 2023 | $4,112 | $264,600 | $127,500 | $137,100 |
| 2022 | $3,715 | $235,700 | $115,600 | $120,100 |
| 2021 | $3,645 | $215,700 | $107,900 | $107,800 |
| 2020 | $3,651 | $214,900 | $107,900 | $107,000 |
| 2019 | $3,645 | $214,900 | $107,900 | $107,000 |
| 2018 | $3,664 | $214,900 | $107,900 | $107,000 |
| 2017 | $3,664 | $214,900 | $107,900 | $107,000 |
| 2016 | $3,638 | $214,100 | $103,700 | $110,400 |
| 2015 | $3,566 | $209,900 | $101,600 | $108,300 |
| 2014 | $866 | $209,900 | $101,600 | $108,300 |
Source: Public Records
Map
Nearby Homes
Your Personal Tour Guide
Ask me questions while you tour the home.