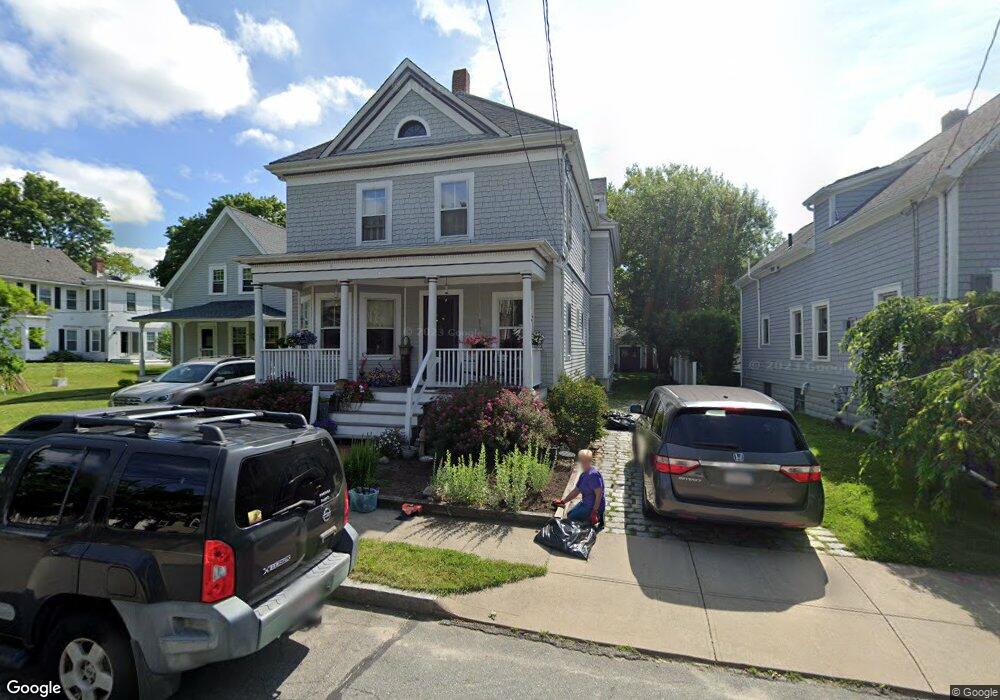
87 Laurel St Fairhaven, MA 02719
Estimated Value: $638,821 - $838,000
4
Beds
3
Baths
2,714
Sq Ft
$274/Sq Ft
Est. Value
About This Home
This home is located at 87 Laurel St, Fairhaven, MA 02719 and is currently estimated at $744,205, approximately $274 per square foot. 87 Laurel St is a home located in Bristol County with nearby schools including Fairhaven High School, City On A Hill Charter Public School New Bedford, and St. Joseph School.
Ownership History
Date
Name
Owned For
Owner Type
Purchase Details
Closed on
Jul 17, 1992
Sold by
Bobola Gary H and Bobola Marjorie J
Bought by
Sylvia Eric J and Cordeiro Mary Alice
Current Estimated Value
Home Financials for this Owner
Home Financials are based on the most recent Mortgage that was taken out on this home.
Original Mortgage
$112,000
Interest Rate
8.54%
Mortgage Type
Purchase Money Mortgage
Create a Home Valuation Report for This Property
The Home Valuation Report is an in-depth analysis detailing your home's value as well as a comparison with similar homes in the area
Home Values in the Area
Average Home Value in this Area
Purchase History
| Date | Buyer | Sale Price | Title Company |
|---|---|---|---|
| Sylvia Eric J | $118,000 | -- |
Source: Public Records
Mortgage History
| Date | Status | Borrower | Loan Amount |
|---|---|---|---|
| Open | Sylvia Eric J | $133,000 | |
| Closed | Sylvia Eric J | $110,000 | |
| Closed | Sylvia Eric J | $112,000 |
Source: Public Records
Tax History
| Year | Tax Paid | Tax Assessment Tax Assessment Total Assessment is a certain percentage of the fair market value that is determined by local assessors to be the total taxable value of land and additions on the property. | Land | Improvement |
|---|---|---|---|---|
| 2025 | $46 | $493,200 | $238,900 | $254,300 |
| 2024 | $4,445 | $481,600 | $238,900 | $242,700 |
| 2023 | $4,212 | $423,300 | $206,100 | $217,200 |
| 2022 | $4,138 | $404,900 | $187,700 | $217,200 |
| 2021 | $4,117 | $364,700 | $170,600 | $194,100 |
| 2020 | $8,350 | $364,700 | $170,600 | $194,100 |
| 2019 | $3,738 | $320,300 | $146,200 | $174,100 |
| 2018 | $3,599 | $306,300 | $139,100 | $167,200 |
| 2017 | $7,274 | $295,600 | $133,900 | $161,700 |
| 2016 | $3,569 | $293,000 | $131,300 | $161,700 |
| 2015 | $3,533 | $290,800 | $131,300 | $159,500 |
Source: Public Records
Map
Nearby Homes
- 58 Washington St
- 0 Nulands Neck Unit 73286360
- 11 Lawton St
- 32 Green St
- 24 Middle St
- 145 Pleasant St
- 8 Washington St
- 2 Washburn Ave
- 32 Cedar St
- 39 Christian St
- 77 Adams St
- 67 Bridge St
- 8 Manor Dr
- 181 Washington St
- 138 Main St Unit 13
- 16 Ash St
- 15 School St
- 24 Academy Ave
- 58 Bayview Ave
- 00 Copeland St
Your Personal Tour Guide
Ask me questions while you tour the home.