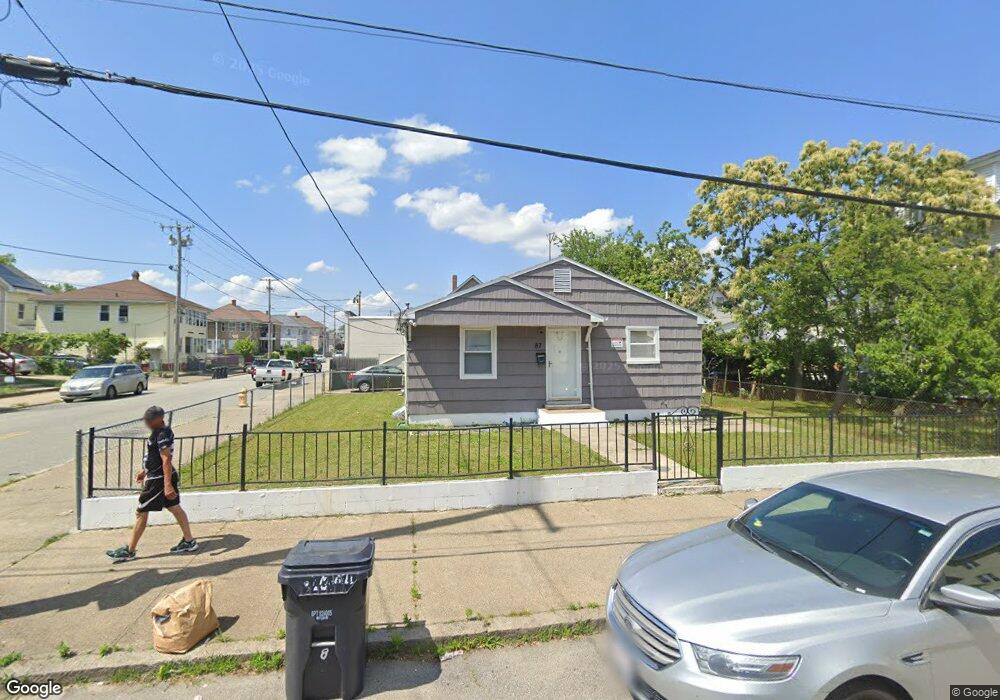
87 Magill St Pawtucket, RI 02860
Woodlawn NeighborhoodEstimated Value: $339,000 - $387,000
3
Beds
1
Bath
864
Sq Ft
$418/Sq Ft
Est. Value
About This Home
This home is located at 87 Magill St, Pawtucket, RI 02860 and is currently estimated at $361,496, approximately $418 per square foot. 87 Magill St is a home located in Providence County with nearby schools including International Charter School, Blackstone Valley Prep Junior High School, and Blackstone Academy Charter School.
Ownership History
Date
Name
Owned For
Owner Type
Purchase Details
Closed on
Apr 30, 2001
Sold by
Lima Manuel J and Lima Julia L
Bought by
Gomez Jose M and Gomez Margarita M
Current Estimated Value
Home Financials for this Owner
Home Financials are based on the most recent Mortgage that was taken out on this home.
Original Mortgage
$80,773
Outstanding Balance
$29,104
Interest Rate
6.88%
Estimated Equity
$332,392
Purchase Details
Closed on
Oct 23, 2000
Sold by
Smith Thomas Q and Connell Mildred
Bought by
Behm Michael
Home Financials for this Owner
Home Financials are based on the most recent Mortgage that was taken out on this home.
Original Mortgage
$90,000
Interest Rate
7.88%
Purchase Details
Closed on
Oct 13, 1989
Sold by
Bishop Philip M
Bought by
Zigbo Wallace N
Home Financials for this Owner
Home Financials are based on the most recent Mortgage that was taken out on this home.
Original Mortgage
$79,100
Interest Rate
10.13%
Create a Home Valuation Report for This Property
The Home Valuation Report is an in-depth analysis detailing your home's value as well as a comparison with similar homes in the area
Home Values in the Area
Average Home Value in this Area
Purchase History
| Date | Buyer | Sale Price | Title Company |
|---|---|---|---|
| Gomez Jose M | $82,000 | -- | |
| Behm Michael | $100,000 | -- | |
| Zigbo Wallace N | $78,000 | -- |
Source: Public Records
Mortgage History
| Date | Status | Borrower | Loan Amount |
|---|---|---|---|
| Open | Zigbo Wallace N | $80,773 | |
| Previous Owner | Zigbo Wallace N | $90,000 | |
| Previous Owner | Zigbo Wallace N | $55,350 | |
| Previous Owner | Zigbo Wallace N | $79,100 |
Source: Public Records
Tax History Compared to Growth
Tax History
| Year | Tax Paid | Tax Assessment Tax Assessment Total Assessment is a certain percentage of the fair market value that is determined by local assessors to be the total taxable value of land and additions on the property. | Land | Improvement |
|---|---|---|---|---|
| 2025 | $3,535 | $268,800 | $118,400 | $150,400 |
| 2024 | $3,317 | $268,800 | $118,400 | $150,400 |
| 2023 | $2,973 | $175,500 | $53,300 | $122,200 |
| 2022 | $2,910 | $175,500 | $53,300 | $122,200 |
| 2021 | $2,910 | $175,500 | $53,300 | $122,200 |
| 2020 | $3,039 | $145,500 | $54,000 | $91,500 |
| 2019 | $3,039 | $145,500 | $54,000 | $91,500 |
| 2018 | $2,929 | $145,500 | $54,000 | $91,500 |
| 2017 | $2,720 | $119,700 | $41,000 | $78,700 |
| 2016 | $2,620 | $119,700 | $41,000 | $78,700 |
| 2015 | $2,620 | $119,700 | $41,000 | $78,700 |
| 2014 | $2,758 | $119,600 | $52,700 | $66,900 |
Source: Public Records
Map
Nearby Homes