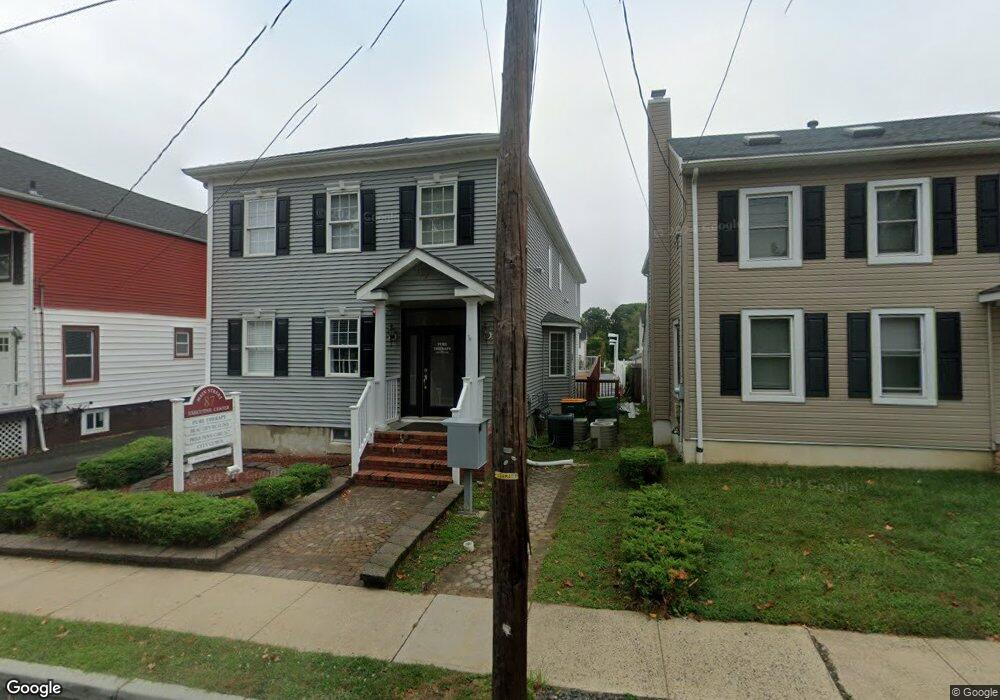
87 Main St Unit 101 Matawan, NJ 07747
Estimated Value: $885,540
Studio
--
Bath
3,636
Sq Ft
$244/Sq Ft
Est. Value
About This Home
This home is located at 87 Main St Unit 101, Matawan, NJ 07747 and is currently estimated at $885,540, approximately $243 per square foot. 87 Main St Unit 101 is a home located in Monmouth County with nearby schools including Matawan Reg High School, St. Joseph Elementary School, and Icob Academy.
Ownership History
Date
Name
Owned For
Owner Type
Purchase Details
Closed on
May 30, 2019
Sold by
Star Alliance Group Llc
Bought by
Agasah Llc
Current Estimated Value
Purchase Details
Closed on
Nov 9, 2011
Sold by
Marchi Mark
Bought by
Star Alliance Group Llc
Create a Home Valuation Report for This Property
The Home Valuation Report is an in-depth analysis detailing your home's value as well as a comparison with similar homes in the area
Home Values in the Area
Average Home Value in this Area
Purchase History
| Date | Buyer | Sale Price | Title Company |
|---|---|---|---|
| Agasah Llc | $525,000 | North East Title Agency Llc | |
| Star Alliance Group Llc | -- | First American Title Ins Co |
Source: Public Records
Tax History
| Year | Tax Paid | Tax Assessment Tax Assessment Total Assessment is a certain percentage of the fair market value that is determined by local assessors to be the total taxable value of land and additions on the property. | Land | Improvement |
|---|---|---|---|---|
| 2025 | $11,585 | $547,800 | $322,200 | $225,600 |
| 2024 | $13,474 | $530,700 | $212,200 | $318,500 |
| 2023 | $13,474 | $619,800 | $202,200 | $417,600 |
| 2022 | $13,813 | $524,300 | $107,200 | $417,100 |
| 2021 | $14,044 | $508,400 | $107,200 | $401,200 |
| 2020 | $14,044 | $513,300 | $112,200 | $401,100 |
| 2019 | $11,111 | $407,000 | $97,200 | $309,800 |
| 2018 | $10,909 | $393,100 | $87,200 | $305,900 |
| 2017 | $10,196 | $362,200 | $62,200 | $300,000 |
| 2016 | $10,150 | $368,300 | $72,200 | $296,100 |
| 2015 | $10,571 | $386,500 | $102,200 | $284,300 |
| 2014 | $11,208 | $411,300 | $117,200 | $294,100 |
Source: Public Records
Map
Nearby Homes
- 68 Main St
- 10 Johnson Ave
- 9 Fountain Ave
- 259 Matawan Ave
- 49 Lucia Ct
- 190 Jackson St
- 3 Harrison Ave
- 255 Harding Blvd
- 207 Lower Main St
- 65 Ravine Dr
- 154 Lower Main St
- 3 Noble Place
- 272 Main St
- 101 Ravine Dr
- 258 Jackson St
- 45 Beechwood Terrace
- 97D Aberdeen Rd
- 55 Lower Main St
- 537 S Atlantic Ave
- 11 Anton Place
Your Personal Tour Guide
Ask me questions while you tour the home.