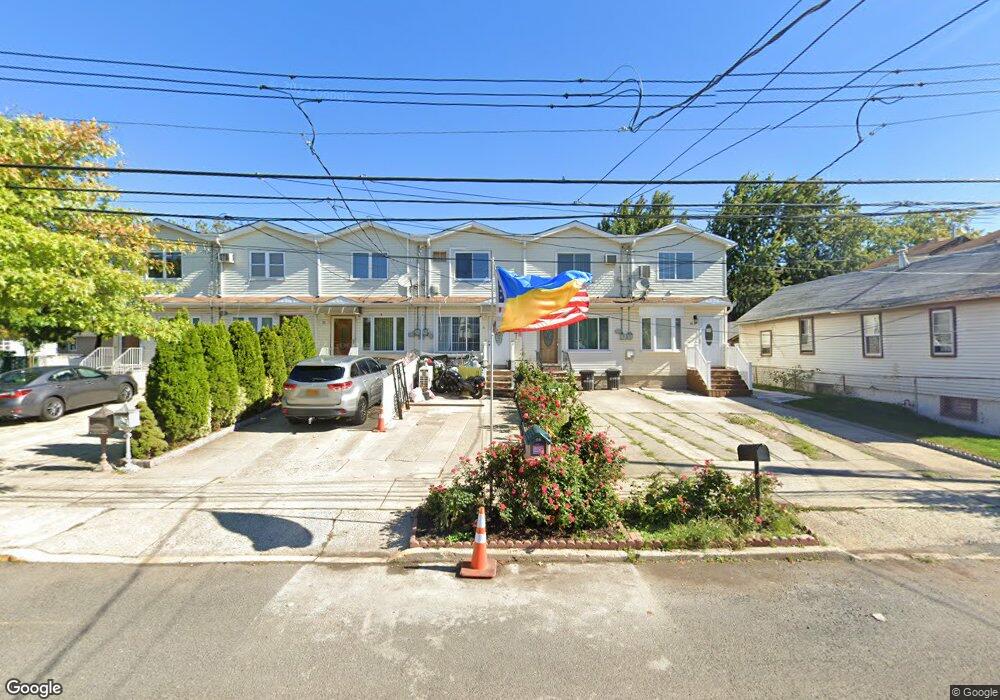
87 Mapleton Ave Staten Island, NY 10306
Midland Beach NeighborhoodEstimated Value: $568,000 - $610,771
2
Beds
2
Baths
1,400
Sq Ft
$425/Sq Ft
Est. Value
About This Home
This home is located at 87 Mapleton Ave, Staten Island, NY 10306 and is currently estimated at $595,443, approximately $425 per square foot. 87 Mapleton Ave is a home located in Richmond County with nearby schools including P.S. 052 John C. Thompson, Is 2 George L Egbert, and New Dorp High School.
Ownership History
Date
Name
Owned For
Owner Type
Purchase Details
Closed on
Jul 22, 2025
Sold by
Prokopchuk Vladimir
Bought by
Prokopchuk Vladimir and Prokopchuk Alexander V
Current Estimated Value
Purchase Details
Closed on
Dec 6, 2004
Sold by
El Hajj Nassim and Sakr Christine
Bought by
Prokopehuk Vladimir
Home Financials for this Owner
Home Financials are based on the most recent Mortgage that was taken out on this home.
Original Mortgage
$256,500
Interest Rate
5.73%
Mortgage Type
Fannie Mae Freddie Mac
Purchase Details
Closed on
Apr 24, 2003
Sold by
Bekker Gregory and Bekker Shella
Bought by
El Hajj Nassim and Sakr Christine
Home Financials for this Owner
Home Financials are based on the most recent Mortgage that was taken out on this home.
Original Mortgage
$175,700
Interest Rate
4.5%
Mortgage Type
Purchase Money Mortgage
Purchase Details
Closed on
Aug 23, 2000
Sold by
Bezner Baruch and Bezner Rosina
Bought by
Bekker Gregory and Bekker Shella
Home Financials for this Owner
Home Financials are based on the most recent Mortgage that was taken out on this home.
Original Mortgage
$118,750
Interest Rate
7.94%
Create a Home Valuation Report for This Property
The Home Valuation Report is an in-depth analysis detailing your home's value as well as a comparison with similar homes in the area
Home Values in the Area
Average Home Value in this Area
Purchase History
| Date | Buyer | Sale Price | Title Company |
|---|---|---|---|
| Prokopchuk Vladimir | -- | None Listed On Document | |
| Prokopehuk Vladimir | $270,000 | -- | |
| El Hajj Nassim | $185,000 | First American Title Ins Co | |
| Bekker Gregory | $125,000 | Chicago Title Insurance Co |
Source: Public Records
Mortgage History
| Date | Status | Borrower | Loan Amount |
|---|---|---|---|
| Previous Owner | Prokopehuk Vladimir | $256,500 | |
| Previous Owner | El Hajj Nassim | $175,700 | |
| Previous Owner | Bekker Gregory | $118,750 |
Source: Public Records
Tax History
| Year | Tax Paid | Tax Assessment Tax Assessment Total Assessment is a certain percentage of the fair market value that is determined by local assessors to be the total taxable value of land and additions on the property. | Land | Improvement |
|---|---|---|---|---|
| 2025 | $3,988 | $35,820 | $2,884 | $32,936 |
| 2024 | $4,000 | $33,180 | $3,113 | $30,067 |
| 2019 | $3,412 | $27,600 | $4,860 | $22,740 |
| 2018 | $3,285 | $17,577 | $4,225 | $13,352 |
| 2017 | $3,081 | $16,583 | $4,448 | $12,135 |
| 2016 | $2,818 | $15,645 | $4,542 | $11,103 |
| 2015 | $2,528 | $14,760 | $4,260 | $10,500 |
| 2014 | $2,528 | $14,760 | $4,260 | $10,500 |
Source: Public Records
Map
Nearby Homes
- 90 Mapleton Ave
- 107 Baden Place
- 750 Patterson Ave
- 793 Patterson Ave
- 23 Peggy Ln
- 225 Colony Ave
- 1031 Father Capodanno Blvd
- 46 Mapleton Ave
- 994 Olympia Blvd
- 1063 Father Capodanno Blvd
- 64 Hempstead Ave
- 66 Hempstead Ave
- 107 Hempstead Ave
- 619 Midland Ave
- 19 Hempstead Ave
- 184 Freeborn St
- 182 Freeborn St
- 17 Hempstead Ave
- 00 Baden Place
- 0 Baden Place Unit 2503276
- 85 Mapleton Ave
- 89 Mapleton Ave
- 89 Mapleton Ave Unit A
- 83 Mapleton Ave
- 89A Mapleton Ave
- 81 Mapleton Ave
- 91 Mapleton Ave
- 122 Baden Place
- 93 Mapleton Ave
- 120 Baden Place
- 95 Mapleton Ave
- 757 Patterson Ave
- 753 Patterson Ave
- 765 Patterson Ave
- 763 Patterson Ave
- 755 Patterson Ave
- 761 Patterson Ave
- 140 Baden Place
- 116 Baden Place
- 751 Patterson Ave
Your Personal Tour Guide
Ask me questions while you tour the home.