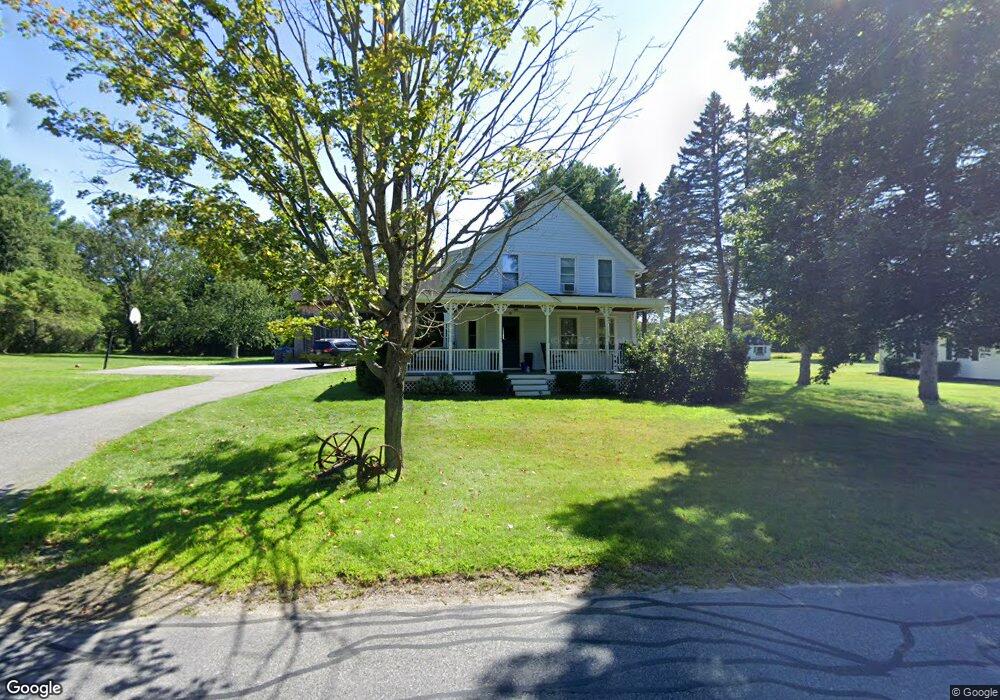
87 Pleasant St Northborough, MA 01532
Estimated Value: $712,000 - $763,000
3
Beds
2
Baths
2,100
Sq Ft
$348/Sq Ft
Est. Value
About This Home
This home is located at 87 Pleasant St, Northborough, MA 01532 and is currently estimated at $730,674, approximately $347 per square foot. 87 Pleasant St is a home located in Worcester County with nearby schools including Lincoln Street Elementary School, Robert E. Melican Middle School, and Algonquin Regional High School.
Ownership History
Date
Name
Owned For
Owner Type
Purchase Details
Closed on
Mar 25, 2019
Sold by
Borey Mary E and Borey Jonathan G
Bought by
Borey Jameson A and Borey Bethany A
Current Estimated Value
Purchase Details
Closed on
Feb 1, 1985
Bought by
Borey George and Borey Mary E
Create a Home Valuation Report for This Property
The Home Valuation Report is an in-depth analysis detailing your home's value as well as a comparison with similar homes in the area
Home Values in the Area
Average Home Value in this Area
Purchase History
| Date | Buyer | Sale Price | Title Company |
|---|---|---|---|
| Borey Jameson A | $420,000 | -- | |
| Borey Jameson A | $420,000 | -- | |
| Borey George | $95,000 | -- |
Source: Public Records
Mortgage History
| Date | Status | Borrower | Loan Amount |
|---|---|---|---|
| Previous Owner | Borey George | $100,000 | |
| Previous Owner | Borey George | $65,000 | |
| Previous Owner | Borey George | $33,000 |
Source: Public Records
Tax History Compared to Growth
Tax History
| Year | Tax Paid | Tax Assessment Tax Assessment Total Assessment is a certain percentage of the fair market value that is determined by local assessors to be the total taxable value of land and additions on the property. | Land | Improvement |
|---|---|---|---|---|
| 2025 | $8,856 | $621,500 | $268,400 | $353,100 |
| 2024 | $7,448 | $521,600 | $214,900 | $306,700 |
| 2023 | $7,604 | $514,100 | $203,300 | $310,800 |
| 2022 | $7,356 | $446,100 | $194,100 | $252,000 |
| 2021 | $7,084 | $413,800 | $177,300 | $236,500 |
| 2020 | $7,254 | $420,500 | $177,300 | $243,200 |
| 2019 | $7,206 | $420,200 | $177,300 | $242,900 |
| 2018 | $6,139 | $353,000 | $166,700 | $186,300 |
| 2017 | $5,935 | $341,300 | $166,700 | $174,600 |
| 2016 | $5,568 | $324,300 | $163,300 | $161,000 |
| 2015 | $5,561 | $332,400 | $171,600 | $160,800 |
| 2014 | $5,800 | $349,600 | $171,600 | $178,000 |
Source: Public Records
Map
Nearby Homes
- 105 Lincoln St
- 39 Pleasant St Unit B19
- 39 Pleasant St Unit C5
- 132 W Main St
- 90 W Main St
- 89 W Main St
- 19 Crestwood Dr Unit 19
- 5 Swan View Common Dr
- 86 Whitney St
- 71 Summer St
- 81 West St
- 85 Hudson St Unit 85
- 185-187 South St
- 38 Mohawk Dr
- 59 School St Unit A-14
- 6 Silas Dr
- 198 South St
- 107 Washburn St
- 6 Vanessa Dr
- 14 Vanessa Dr
- 91 Pleasant St
- 92 Pleasant St
- 99 Pleasant St
- 94 Pleasant St
- 75 Pleasant St
- 73 Pleasant St
- 100 Pleasant St
- 11 Capt John Edwards Dr
- 104 Pleasant St
- 11 John Edward Dr
- 105 Pleasant St
- 109 Pleasant St
- 71 Pleasant St
- 6 Capt John Edwards Dr
- 67 Pleasant St
- 110 Pleasant St
- 15 Capt John Edwards Dr
- 118 Lincoln St
- 10 John Edward Dr
- 10 Capt John Edwards Dr