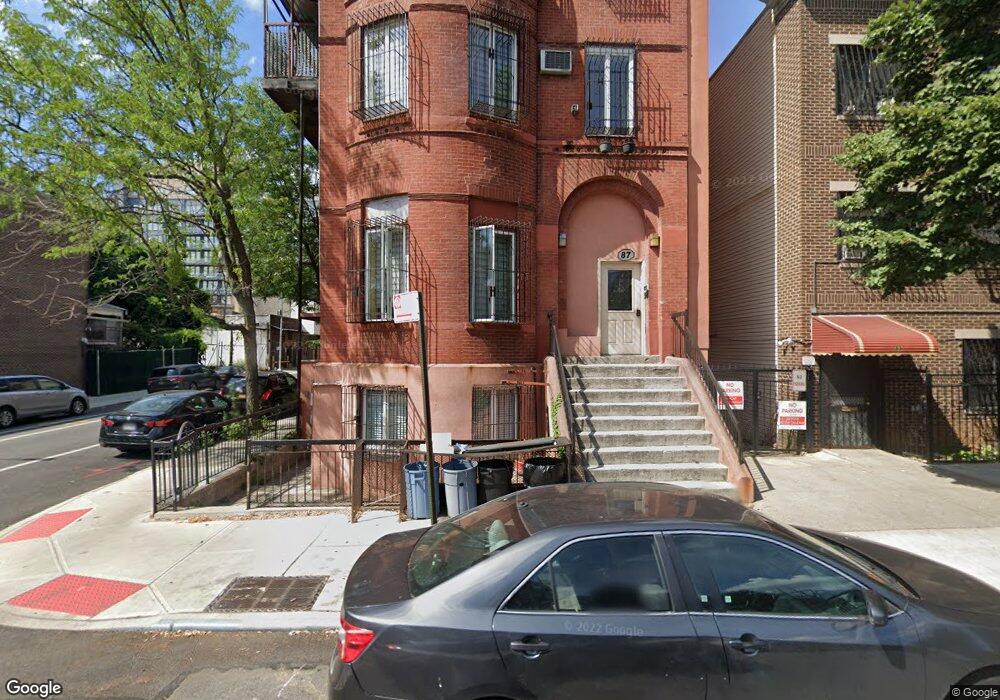
87 S 9th St Unit 1 Brooklyn, NY 11211
South Williamsburg NeighborhoodEstimated Value: $867,000 - $2,083,000
--
Bed
--
Bath
1,617
Sq Ft
$879/Sq Ft
Est. Value
About This Home
This home is located at 87 S 9th St Unit 1, Brooklyn, NY 11211 and is currently estimated at $1,421,968, approximately $879 per square foot. 87 S 9th St Unit 1 is a home located in Kings County with nearby schools including P.S. 16 Leonard Dunkly, Williamsburg Collegiate Charter School, and Williamsburg Montessori.
Ownership History
Date
Name
Owned For
Owner Type
Purchase Details
Closed on
Jul 2, 2019
Sold by
Bais Simcha Realty Trust
Bought by
Beth Simcha Realty Trust and Mendel Greenberger-Trustee
Current Estimated Value
Purchase Details
Closed on
Jun 20, 2001
Sold by
Rubinstein Abraham
Bought by
Bais Simcha Realty Trust
Purchase Details
Closed on
Feb 16, 1998
Sold by
87 South 9Th Street Corp
Bought by
Rubinstein Abraham
Home Financials for this Owner
Home Financials are based on the most recent Mortgage that was taken out on this home.
Original Mortgage
$227,150
Interest Rate
7.04%
Purchase Details
Closed on
Dec 31, 1997
Sold by
8 South 9 Llc
Bought by
Adler Aron
Home Financials for this Owner
Home Financials are based on the most recent Mortgage that was taken out on this home.
Original Mortgage
$227,150
Interest Rate
7.04%
Create a Home Valuation Report for This Property
The Home Valuation Report is an in-depth analysis detailing your home's value as well as a comparison with similar homes in the area
Home Values in the Area
Average Home Value in this Area
Purchase History
| Date | Buyer | Sale Price | Title Company |
|---|---|---|---|
| Beth Simcha Realty Trust | -- | -- | |
| Bais Simcha Realty Trust | -- | -- | |
| Bais Simcha Realty Trust | -- | -- | |
| Rubinstein Abraham | $325,000 | Security Title Guaranty Co | |
| Adler Aron | -- | -- |
Source: Public Records
Mortgage History
| Date | Status | Borrower | Loan Amount |
|---|---|---|---|
| Previous Owner | Rubinstein Abraham | $227,150 | |
| Previous Owner | Adler Aron | $85,000 |
Source: Public Records
Tax History Compared to Growth
Tax History
| Year | Tax Paid | Tax Assessment Tax Assessment Total Assessment is a certain percentage of the fair market value that is determined by local assessors to be the total taxable value of land and additions on the property. | Land | Improvement |
|---|---|---|---|---|
| 2025 | $13,085 | $235,628 | $5,362 | $230,266 |
| 2024 | $13,085 | $196,354 | $5,362 | $190,992 |
| 2023 | $11,888 | $163,628 | $5,362 | $158,266 |
| 2022 | $10,979 | $160,756 | $5,362 | $155,394 |
| 2021 | $10,192 | $154,915 | $5,362 | $149,553 |
| 2020 | $7,644 | $169,947 | $5,362 | $164,585 |
| 2019 | $10,154 | $194,094 | $5,362 | $188,732 |
| 2018 | $9,482 | $74,547 | $1,647 | $72,900 |
| 2017 | $8,779 | $69,026 | $1,773 | $67,253 |
| 2016 | $8,240 | $63,913 | $2,052 | $61,861 |
| 2015 | $5,349 | $63,913 | $2,463 | $61,450 |
| 2014 | $5,349 | $61,930 | $2,864 | $59,066 |
Source: Public Records
Map
Nearby Homes
- 95 S 10th St Unit 22
- 60 Broadway Unit 7K
- 60 Broadway Unit 6H
- 60 Broadway Unit 4Q
- 60 Broadway Unit 9D
- 138 Broadway Unit 5G
- 138 Broadway Unit PH6D
- 138 Broadway Unit 1D
- 429 Kent Ave Unit TH8
- 429 Kent Ave Unit 301
- 429 Kent Ave Unit 329
- 429 Kent Ave Unit 503
- 429 Kent Ave Unit TH8
- 429 Kent Ave Unit 810
- 429 Kent Ave Unit L62
- 429 Kent Ave Unit 203
- 429 Kent Ave Unit 329
- 429 Kent Ave Unit 740
- 429 Kent Ave Unit D725
- 429 Kent Ave Unit 236
- 87 S 9th St Unit 1
- 87 S 9th St Unit 1
- 87 S 9th St Unit 1
- 87 S 9th St Unit 1
- 87 S 9th St Unit 1
- 87 S 9th St
- 89 S 9th St Unit 2
- 91 S 9th St
- 91 S 9th St Unit 12C
- 91 S 9th St Unit 10A
- 93 S 9th St
- 409 Berry St
- 85 S 9th St
- 407 Berry St Unit 6B
- 407 Berry St Unit 6A
- 407 Berry St Unit 5B
- 407 Berry St Unit 5A
- 407 Berry St Unit 4B
- 407 Berry St Unit 4A
- 407 Berry St Unit 3B