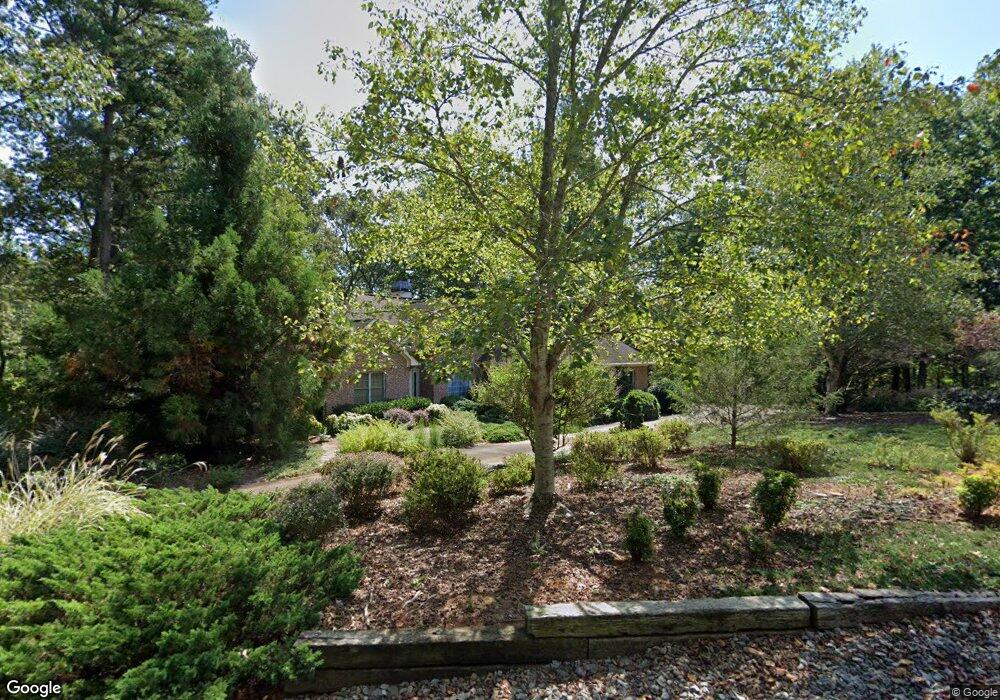
87 Sequoyah Place Dahlonega, GA 30533
Estimated Value: $488,000 - $647,000
5
Beds
4
Baths
1,806
Sq Ft
$325/Sq Ft
Est. Value
About This Home
This home is located at 87 Sequoyah Place, Dahlonega, GA 30533 and is currently estimated at $586,064, approximately $324 per square foot. 87 Sequoyah Place is a home located in Lumpkin County with nearby schools including Lumpkin County High School.
Ownership History
Date
Name
Owned For
Owner Type
Purchase Details
Closed on
Feb 12, 2024
Sold by
Smith Granger Michele
Bought by
Granger Michele Smith and Smith Gay L
Current Estimated Value
Purchase Details
Closed on
Jul 10, 2012
Sold by
Smith Gary S
Bought by
Smith Gary S and Smith Gay L
Purchase Details
Closed on
Jan 26, 2012
Sold by
Smith Gary
Bought by
Smith Carol A
Purchase Details
Closed on
Oct 20, 2009
Sold by
Smith Carol A
Bought by
Smith Gary S
Purchase Details
Closed on
Nov 19, 1999
Sold by
Smith Gary S
Bought by
Smith Gary S
Purchase Details
Closed on
Nov 9, 1999
Sold by
Carol A
Bought by
Smith Gary S
Purchase Details
Closed on
Mar 4, 1997
Sold by
Clary Wallace B
Bought by
Smith Gary S
Purchase Details
Closed on
Mar 26, 1996
Sold by
Dunlap Edgar B
Bought by
Clary Wallace B
Purchase Details
Closed on
Nov 7, 1995
Bought by
Dunlap Edgar B
Create a Home Valuation Report for This Property
The Home Valuation Report is an in-depth analysis detailing your home's value as well as a comparison with similar homes in the area
Home Values in the Area
Average Home Value in this Area
Purchase History
| Date | Buyer | Sale Price | Title Company |
|---|---|---|---|
| Granger Michele Smith | -- | -- | |
| Granger Michele Smith | -- | -- | |
| Smith Gary S | -- | -- | |
| Smith Carol A | -- | -- | |
| Smith Gary S | -- | -- | |
| Smith Gary S | -- | -- | |
| Smith Gary S | -- | -- | |
| Smith Gary S | $13,100 | -- | |
| Clary Wallace B | -- | -- | |
| Dunlap Edgar B | -- | -- |
Source: Public Records
Tax History Compared to Growth
Tax History
| Year | Tax Paid | Tax Assessment Tax Assessment Total Assessment is a certain percentage of the fair market value that is determined by local assessors to be the total taxable value of land and additions on the property. | Land | Improvement |
|---|---|---|---|---|
| 2024 | $881 | $142,955 | $12,120 | $130,835 |
| 2023 | $448 | $135,623 | $12,120 | $123,503 |
| 2022 | $563 | $124,060 | $12,120 | $111,940 |
| 2021 | $404 | $108,252 | $12,120 | $96,132 |
| 2020 | $389 | $106,142 | $12,120 | $94,022 |
| 2019 | $401 | $106,142 | $12,120 | $94,022 |
| 2018 | $304 | $94,309 | $12,120 | $82,189 |
| 2017 | $293 | $92,188 | $12,120 | $80,068 |
| 2016 | $49 | $71,734 | $12,120 | $59,614 |
| 2015 | $43 | $71,734 | $12,120 | $59,614 |
| 2014 | $43 | $72,453 | $12,120 | $60,333 |
| 2013 | -- | $73,171 | $12,120 | $61,051 |
Source: Public Records
Map
Nearby Homes
- 483 Winters Mountain Rd
- 1228 Winters Mountain Rd
- 300 Mountain Ridge Dr
- 0 Bearden Rd Unit 10598024
- 0 Bearden Rd Unit 7642996
- 1190 Winters Mountain Rd
- 260 Holly Ln
- 7.123 Acres Halls Mill Rd
- 83 Austin Ct
- 87 Tolleffs Trail
- 03 Kate Rd
- 0 Gold View Dr
- 302 Pointe Cir
- 55 Overlook Cove
- 51 Overlook Cove
- 45 Overlook Cove
- 47 Overlook Cove
- 25 Overlook Cove
- 00 Captain McDonald Rd
- 350 Galahad Rd
- 24 Sequoyah Place
- 19 Sequoyah Place
- 22 Briar Patch Rd
- 78 Sequoyah Place Unit 21
- 78 Sequoyah Place
- 132 Sequoyah Place
- 61 Briar Patch Rd
- 128 Choctaw Ridge S
- 3332 Highway 52 W
- 141 Pine Bark Path
- 639 Wildwood Pkwy
- 192 Old Steele Hollow
- 800 Old Steele Hollow
- 61 Crabapple Ridge
- 825 River Highlands Rd Unit 9
- 825 River Highlands Rd
- 797 River Highlands Rd
- 102 Twisted Pines Crossing
- 55 Pine Bark Path
- 117 Twisted Pines Crossing