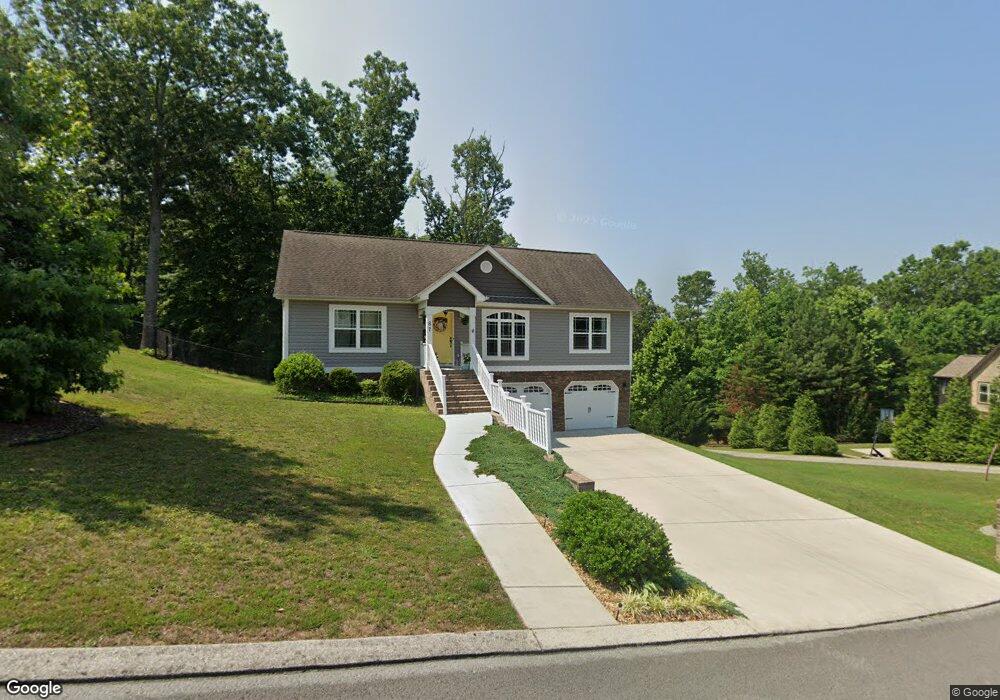
87 Shadowcreek Ct Unit 230 Flintstone, GA 30725
High Point NeighborhoodEstimated Value: $317,463 - $359,000
--
Bed
2
Baths
1,272
Sq Ft
$268/Sq Ft
Est. Value
About This Home
This home is located at 87 Shadowcreek Ct Unit 230, Flintstone, GA 30725 and is currently estimated at $340,366, approximately $267 per square foot. 87 Shadowcreek Ct Unit 230 is a home located in Walker County with nearby schools including Chattanooga Valley Elementary School, Chattanooga Valley Middle School, and Ridgeland High School.
Ownership History
Date
Name
Owned For
Owner Type
Purchase Details
Closed on
Sep 19, 2023
Sold by
Wingard Kathryn
Bought by
Franks Ashlyn
Current Estimated Value
Home Financials for this Owner
Home Financials are based on the most recent Mortgage that was taken out on this home.
Original Mortgage
$285,000
Outstanding Balance
$279,255
Interest Rate
7.23%
Mortgage Type
New Conventional
Estimated Equity
$61,111
Purchase Details
Closed on
Mar 30, 2017
Sold by
Baker
Bought by
Wingard Kathryn and Wingard Benjamin
Home Financials for this Owner
Home Financials are based on the most recent Mortgage that was taken out on this home.
Original Mortgage
$154,850
Interest Rate
4.1%
Mortgage Type
New Conventional
Purchase Details
Closed on
Sep 16, 2005
Sold by
Not Provided
Bought by
Baker & Summers Construction and Co Inc
Create a Home Valuation Report for This Property
The Home Valuation Report is an in-depth analysis detailing your home's value as well as a comparison with similar homes in the area
Home Values in the Area
Average Home Value in this Area
Purchase History
| Date | Buyer | Sale Price | Title Company |
|---|---|---|---|
| Franks Ashlyn | $300,000 | -- | |
| Wingard Kathryn | $163,000 | -- | |
| Baker & Summers Construction | -- | -- |
Source: Public Records
Mortgage History
| Date | Status | Borrower | Loan Amount |
|---|---|---|---|
| Open | Franks Ashlyn | $285,000 | |
| Previous Owner | Wingard Kathryn | $154,850 |
Source: Public Records
Tax History Compared to Growth
Tax History
| Year | Tax Paid | Tax Assessment Tax Assessment Total Assessment is a certain percentage of the fair market value that is determined by local assessors to be the total taxable value of land and additions on the property. | Land | Improvement |
|---|---|---|---|---|
| 2024 | $2,615 | $134,656 | $16,000 | $118,656 |
| 2023 | $2,842 | $128,589 | $16,000 | $112,589 |
| 2022 | $2,720 | $111,616 | $16,000 | $95,616 |
| 2021 | $2,047 | $74,666 | $10,000 | $64,666 |
| 2020 | $1,709 | $59,262 | $10,000 | $49,262 |
| 2019 | $1,740 | $59,262 | $10,000 | $49,262 |
| 2018 | $1,568 | $59,262 | $10,000 | $49,262 |
| 2017 | $1,457 | $44,392 | $8,000 | $36,392 |
| 2016 | $196 | $8,000 | $8,000 | $0 |
| 2015 | $313 | $12,000 | $12,000 | $0 |
| 2014 | $303 | $12,000 | $12,000 | $0 |
| 2013 | -- | $12,000 | $12,000 | $0 |
Source: Public Records
Map
Nearby Homes
- 0 Roundtree Ct Unit 1514898
- 0 Roundtree Ct Unit RTC2914889
- 301 Hidden Oaks Dr
- 433 Stanford Dr
- 144 N Victor Dr
- 3509 N Highway N 341
- 1080 Harp Switch Rd
- 3269 N Highway 341
- 0 Casey Dr
- 426 Simmons Tawzer Rd
- 2751 N Highway 341
- 57 Fir St
- 413 Harp Switch Rd
- 201 Laurelwood Cir
- 852 Old Grand Center Rd
- 757 W Schmitt Rd
- 12 Mark Cir
- 780 Marble Top Rd
- 221 Highland Dr
- 810 Marble Top Rd
- 87 Shadowcreek Ct
- 69 Shadowcreek Ct
- 53 Shadowcreek Ct
- 86 Shadowcreek Ct
- 109 Shadowcreek Ct
- 101 Shadowcreek Ct
- 101 Shadowcreek Ct Unit 232
- 37 Shadowcreek Ct
- 70 Shadowcreek Ct
- 123 Shadowcreek Ct
- 36 Shadowcreek Ct
- 73 Crosswinds Dr
- 63 Crosswinds Dr
- 21 Shadowcreek Ct
- 143 Shadowcreek Ct
- 35 Crosswinds Dr
- 101 Durance Dr
- 0 Crosswinds Dr
- 77 Durance Dr
- 149 Shadowcreek Ct