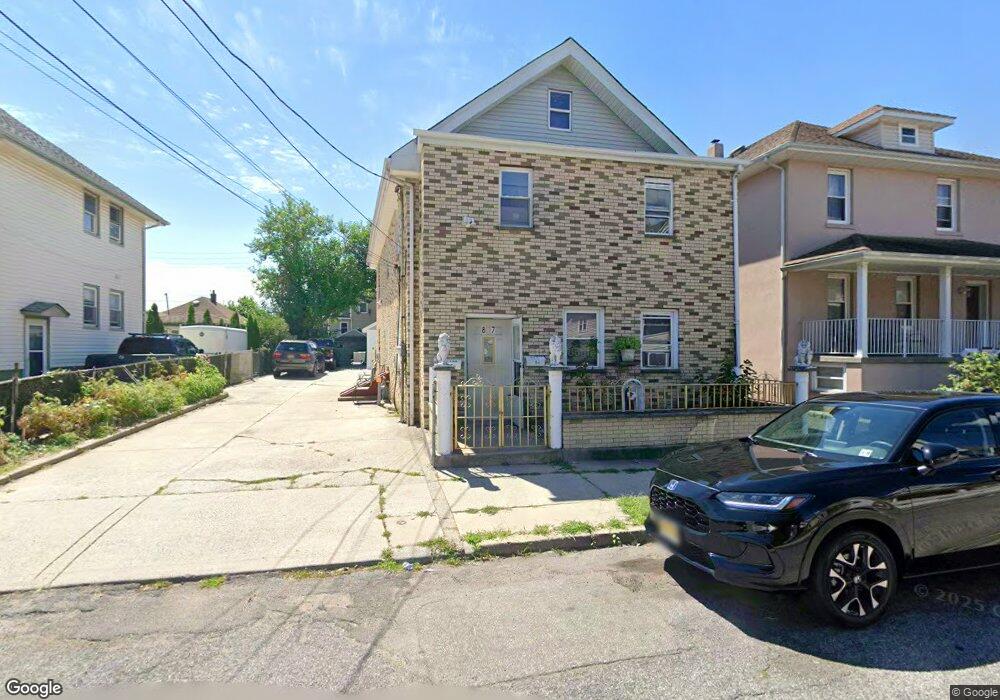
87 Troast St Unit 1 Hackensack, NJ 07601
Estimated Value: $561,000 - $697,765
2
Beds
1
Bath
2,218
Sq Ft
$298/Sq Ft
Est. Value
About This Home
This home is located at 87 Troast St Unit 1, Hackensack, NJ 07601 and is currently estimated at $661,191, approximately $298 per square foot. 87 Troast St Unit 1 is a home located in Bergen County with nearby schools including Hackensack High School and George Washington School.
Ownership History
Date
Name
Owned For
Owner Type
Purchase Details
Closed on
Oct 3, 2024
Sold by
Gomes Jose and Matias Joaquim E
Bought by
Tenempaguay Raul
Current Estimated Value
Purchase Details
Closed on
Aug 14, 2023
Sold by
Matias Joaquim E and Gomes Jose
Bought by
Matias Joaquim E and Ascenso Agostinho Matias
Create a Home Valuation Report for This Property
The Home Valuation Report is an in-depth analysis detailing your home's value as well as a comparison with similar homes in the area
Home Values in the Area
Average Home Value in this Area
Purchase History
| Date | Buyer | Sale Price | Title Company |
|---|---|---|---|
| Tenempaguay Raul | $525,000 | Prestige Title | |
| Tenempaguay Raul | $525,000 | Prestige Title | |
| Tenempaguay Raul | $525,000 | Prestige Title | |
| Matias Joaquim E | -- | None Listed On Document |
Source: Public Records
Tax History
| Year | Tax Paid | Tax Assessment Tax Assessment Total Assessment is a certain percentage of the fair market value that is determined by local assessors to be the total taxable value of land and additions on the property. | Land | Improvement |
|---|---|---|---|---|
| 2025 | $12,600 | $412,300 | $153,100 | $259,200 |
| 2024 | $11,870 | $412,300 | $153,100 | $259,200 |
| 2023 | $11,050 | $412,300 | $153,100 | $259,200 |
| 2022 | $11,300 | $403,300 | $145,700 | $257,600 |
| 2021 | $10,999 | $335,000 | $130,500 | $204,500 |
| 2020 | $11,085 | $335,000 | $130,500 | $204,500 |
| 2019 | $11,071 | $329,800 | $128,500 | $201,300 |
| 2018 | $11,266 | $330,100 | $125,500 | $204,600 |
| 2017 | $11,092 | $324,800 | $123,500 | $201,300 |
| 2016 | $10,354 | $306,500 | $108,500 | $198,000 |
| 2015 | $10,586 | $309,600 | $134,600 | $175,000 |
| 2014 | $10,035 | $309,600 | $134,600 | $175,000 |
Source: Public Records
Map
Nearby Homes
- 62 Frederick St Unit 1
- 99 Kansas St
- 113 Kansas St
- 115 Kansas St
- 84 Kansas St
- 337 Hudson St
- 74 Union St
- 75 Union St Unit 5E
- 9 Vreeland Ave Unit 3A
- 54 Polifly Rd Unit 201
- 115 Polifly Rd Unit 5D
- 115 River Rd
- 72 Lawrence St
- 467 Hudson St
- 311 Marvin Ave
- 65 Mcdougall Ln
- 235 Larch Ave
- 279 Clark St Unit A-7
- 16 Maple Ave
- 38 Chestnut Ave
- 87 Troast St
- 89 Troast St
- 79 Troast St
- 93 Troast St Unit 95
- 77 Troast St
- 88 Pink St
- 92 Pink St
- 86 Pink St
- 92 Troast St Unit 1
- 92 Troast St Unit 2
- 92 Troast St
- 84 Troast St
- 99 Troast St
- 100 Troast St Unit 3
- 100 Troast St
- 100 Troast St Unit 2nd Floor
- 100 Troast St Unit 2nd Fl
- 98 Pink St
- 75 Troast St
- 82 Pink St
Your Personal Tour Guide
Ask me questions while you tour the home.