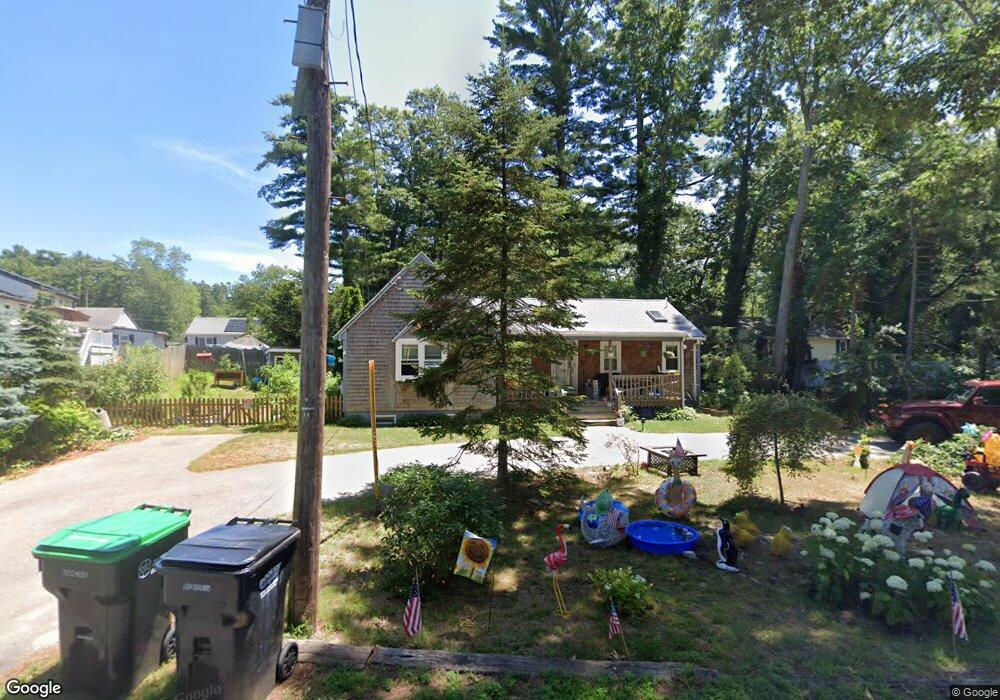
87 Waltham St Hanson, MA 02341
Estimated Value: $388,000 - $507,000
1
Bed
1
Bath
1,024
Sq Ft
$428/Sq Ft
Est. Value
About This Home
This home is located at 87 Waltham St, Hanson, MA 02341 and is currently estimated at $437,913, approximately $427 per square foot. 87 Waltham St is a home.
Ownership History
Date
Name
Owned For
Owner Type
Purchase Details
Closed on
Jul 18, 2018
Sold by
Sansone David M and Sansone Judith B
Bought by
Caldas Judith B
Current Estimated Value
Home Financials for this Owner
Home Financials are based on the most recent Mortgage that was taken out on this home.
Original Mortgage
$200,000
Outstanding Balance
$147,818
Interest Rate
4.5%
Mortgage Type
Unknown
Estimated Equity
$290,095
Purchase Details
Closed on
Aug 15, 1997
Sold by
Warren Robert B and Warren Jacqueline J
Bought by
Sansone David M and Sansone Judith B
Create a Home Valuation Report for This Property
The Home Valuation Report is an in-depth analysis detailing your home's value as well as a comparison with similar homes in the area
Home Values in the Area
Average Home Value in this Area
Purchase History
| Date | Buyer | Sale Price | Title Company |
|---|---|---|---|
| Caldas Judith B | -- | -- | |
| Sansone David M | $121,500 | -- |
Source: Public Records
Mortgage History
| Date | Status | Borrower | Loan Amount |
|---|---|---|---|
| Open | Caldas Judith B | $200,000 | |
| Previous Owner | Sansone David M | $221,250 | |
| Previous Owner | Sansone David M | $208,000 | |
| Previous Owner | Sansone David M | $170,520 |
Source: Public Records
Tax History Compared to Growth
Tax History
| Year | Tax Paid | Tax Assessment Tax Assessment Total Assessment is a certain percentage of the fair market value that is determined by local assessors to be the total taxable value of land and additions on the property. | Land | Improvement |
|---|---|---|---|---|
| 2025 | $4,648 | $347,400 | $141,400 | $206,000 |
| 2024 | $4,513 | $337,300 | $137,300 | $200,000 |
| 2023 | $4,417 | $311,500 | $137,300 | $174,200 |
| 2022 | $4,273 | $283,200 | $124,800 | $158,400 |
| 2021 | $3,721 | $246,400 | $120,000 | $126,400 |
| 2020 | $3,636 | $238,100 | $115,900 | $122,200 |
| 2019 | $3,384 | $217,900 | $106,600 | $111,300 |
| 2018 | $3,318 | $209,600 | $102,500 | $107,100 |
| 2017 | $3,285 | $205,600 | $91,100 | $114,500 |
| 2016 | $3,320 | $200,600 | $91,100 | $109,500 |
| 2015 | $3,152 | $198,000 | $91,100 | $106,900 |
Source: Public Records
Map
Nearby Homes