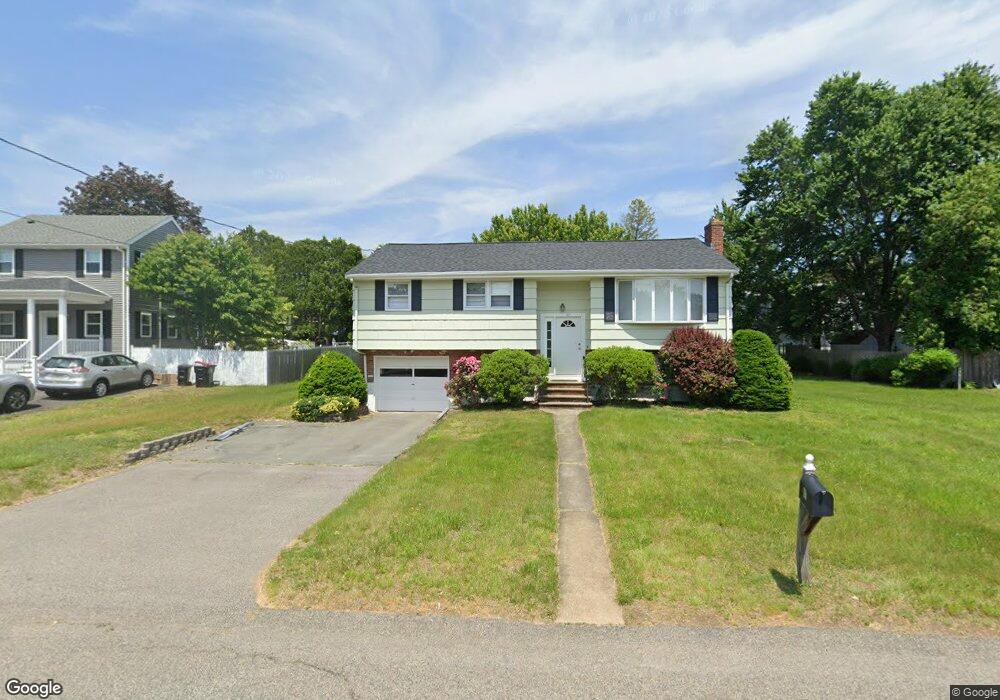
87 Westfield Dr Brockton, MA 02301
Estimated Value: $600,230 - $622,000
3
Beds
1
Bath
1,588
Sq Ft
$385/Sq Ft
Est. Value
About This Home
This home is located at 87 Westfield Dr, Brockton, MA 02301 and is currently estimated at $611,558, approximately $385 per square foot. 87 Westfield Dr is a home located in Plymouth County with nearby schools including Hancock Elementary School, Manthala George Jr. School, and Louis F Angelo Elementary School.
Ownership History
Date
Name
Owned For
Owner Type
Purchase Details
Closed on
Dec 4, 2012
Sold by
Pelaggi Robert J
Bought by
Robert J Pelaggi Ret
Current Estimated Value
Purchase Details
Closed on
Sep 1, 1999
Sold by
Levine Robert B and Levine Barbara K
Bought by
Pelaggi Robert J
Home Financials for this Owner
Home Financials are based on the most recent Mortgage that was taken out on this home.
Original Mortgage
$70,500
Interest Rate
7.5%
Mortgage Type
Purchase Money Mortgage
Create a Home Valuation Report for This Property
The Home Valuation Report is an in-depth analysis detailing your home's value as well as a comparison with similar homes in the area
Home Values in the Area
Average Home Value in this Area
Purchase History
| Date | Buyer | Sale Price | Title Company |
|---|---|---|---|
| Robert J Pelaggi Ret | -- | -- | |
| Pelaggi Robert J | $170,500 | -- |
Source: Public Records
Mortgage History
| Date | Status | Borrower | Loan Amount |
|---|---|---|---|
| Previous Owner | Pelaggi Robert J | $68,000 | |
| Previous Owner | Pelaggi Robert J | $70,500 |
Source: Public Records
Tax History Compared to Growth
Tax History
| Year | Tax Paid | Tax Assessment Tax Assessment Total Assessment is a certain percentage of the fair market value that is determined by local assessors to be the total taxable value of land and additions on the property. | Land | Improvement |
|---|---|---|---|---|
| 2025 | $6,141 | $507,100 | $145,000 | $362,100 |
| 2024 | $5,784 | $481,200 | $145,000 | $336,200 |
| 2023 | $5,478 | $422,000 | $110,000 | $312,000 |
| 2022 | $5,053 | $361,700 | $100,000 | $261,700 |
| 2021 | $4,808 | $331,600 | $95,000 | $236,600 |
| 2020 | $4,451 | $293,800 | $91,000 | $202,800 |
| 2019 | $4,401 | $283,200 | $85,500 | $197,700 |
| 2018 | $4,328 | $269,500 | $85,500 | $184,000 |
| 2017 | $3,903 | $242,400 | $85,500 | $156,900 |
| 2016 | $3,555 | $204,800 | $81,500 | $123,300 |
| 2015 | $3,719 | $204,900 | $81,500 | $123,400 |
| 2014 | $3,461 | $190,900 | $81,500 | $109,400 |
Source: Public Records
Map
Nearby Homes