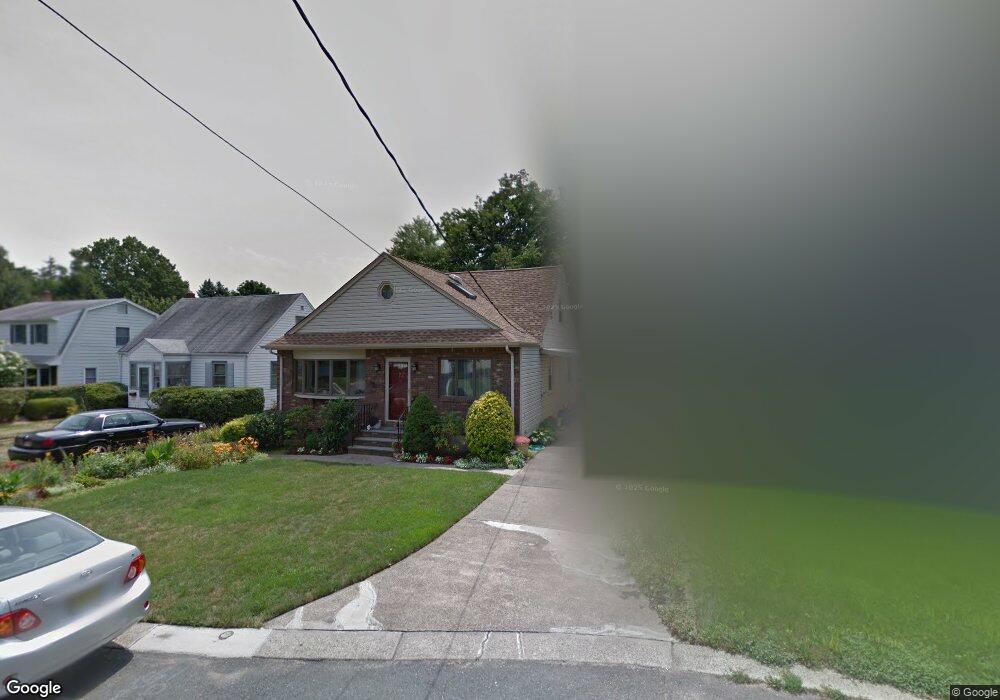
87 Wilkens Dr Dumont, NJ 07628
Estimated Value: $631,117 - $714,000
--
Bed
--
Bath
1,472
Sq Ft
$455/Sq Ft
Est. Value
About This Home
This home is located at 87 Wilkens Dr, Dumont, NJ 07628 and is currently estimated at $669,279, approximately $454 per square foot. 87 Wilkens Dr is a home located in Bergen County with nearby schools including Dumont High School.
Ownership History
Date
Name
Owned For
Owner Type
Purchase Details
Closed on
Apr 14, 2014
Sold by
Wilkens Drive Holdings Llc
Bought by
Canaca Jose C
Current Estimated Value
Home Financials for this Owner
Home Financials are based on the most recent Mortgage that was taken out on this home.
Original Mortgage
$335,500
Outstanding Balance
$255,235
Interest Rate
4.36%
Mortgage Type
New Conventional
Estimated Equity
$414,044
Purchase Details
Closed on
Aug 13, 2013
Sold by
Somet R E Development Llc
Bought by
Wilkens Drive Holdings Llc
Purchase Details
Closed on
Jun 6, 2013
Sold by
Horniceck Janine P
Bought by
Somet Re Development Llc
Create a Home Valuation Report for This Property
The Home Valuation Report is an in-depth analysis detailing your home's value as well as a comparison with similar homes in the area
Home Values in the Area
Average Home Value in this Area
Purchase History
| Date | Buyer | Sale Price | Title Company |
|---|---|---|---|
| Canaca Jose C | $425,500 | -- | |
| Wilkens Drive Holdings Llc | $185,000 | -- | |
| Somet Re Development Llc | $160,000 | -- |
Source: Public Records
Mortgage History
| Date | Status | Borrower | Loan Amount |
|---|---|---|---|
| Open | Canaca Jose C | $335,500 |
Source: Public Records
Tax History Compared to Growth
Tax History
| Year | Tax Paid | Tax Assessment Tax Assessment Total Assessment is a certain percentage of the fair market value that is determined by local assessors to be the total taxable value of land and additions on the property. | Land | Improvement |
|---|---|---|---|---|
| 2025 | $11,500 | $582,800 | $285,000 | $297,800 |
| 2024 | $11,217 | $282,900 | $160,000 | $122,900 |
| 2023 | $10,985 | $282,900 | $160,000 | $122,900 |
| 2022 | $10,985 | $282,900 | $160,000 | $122,900 |
| 2021 | $10,931 | $282,900 | $160,000 | $122,900 |
| 2020 | $10,634 | $282,900 | $160,000 | $122,900 |
| 2019 | $10,380 | $282,900 | $160,000 | $122,900 |
| 2018 | $10,167 | $282,900 | $160,000 | $122,900 |
| 2017 | $9,972 | $282,900 | $160,000 | $122,900 |
| 2016 | $9,740 | $282,900 | $160,000 | $122,900 |
| 2015 | $9,517 | $282,900 | $160,000 | $122,900 |
| 2014 | $9,330 | $264,800 | $160,000 | $104,800 |
Source: Public Records
Map
Nearby Homes