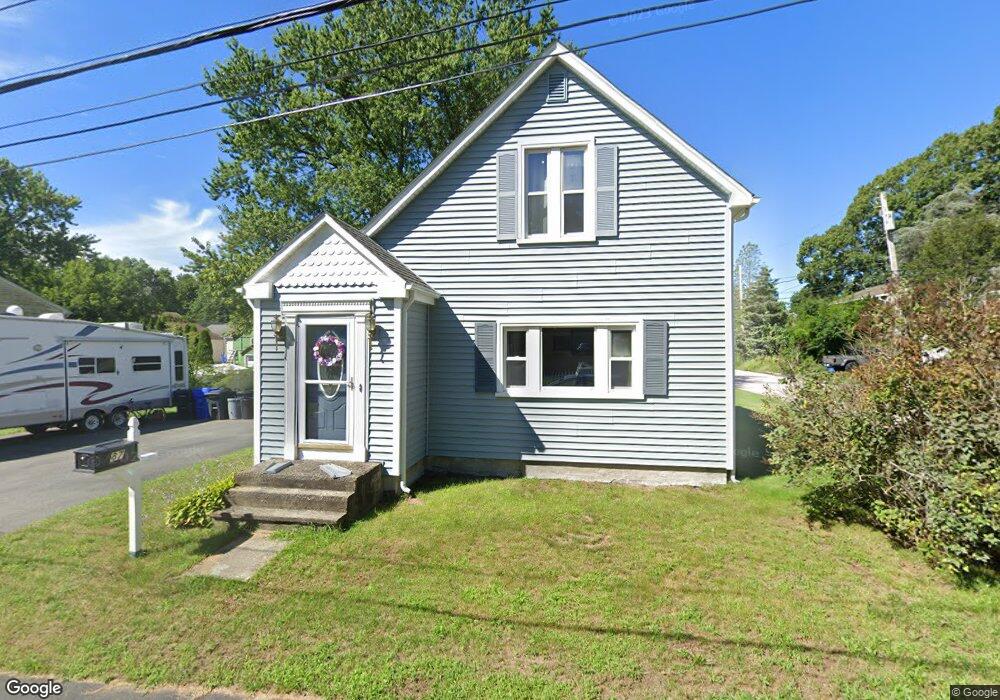
87 Worcester Ave Riverside, RI 02915
Riverside NeighborhoodEstimated Value: $370,340 - $411,000
2
Beds
1
Bath
1,012
Sq Ft
$388/Sq Ft
Est. Value
About This Home
This home is located at 87 Worcester Ave, Riverside, RI 02915 and is currently estimated at $392,835, approximately $388 per square foot. 87 Worcester Ave is a home located in Providence County with nearby schools including East Providence High School, St Mary Academy-Bay View, and St Luke Elementary School.
Ownership History
Date
Name
Owned For
Owner Type
Purchase Details
Closed on
Oct 5, 1999
Sold by
Butler Lena J Est and Dolby
Bought by
Dolby William J and Dolby Donna
Current Estimated Value
Home Financials for this Owner
Home Financials are based on the most recent Mortgage that was taken out on this home.
Original Mortgage
$70,000
Interest Rate
7.85%
Mortgage Type
Purchase Money Mortgage
Create a Home Valuation Report for This Property
The Home Valuation Report is an in-depth analysis detailing your home's value as well as a comparison with similar homes in the area
Home Values in the Area
Average Home Value in this Area
Purchase History
| Date | Buyer | Sale Price | Title Company |
|---|---|---|---|
| Dolby William J | $35,000 | -- | |
| Dolby William J | $35,000 | -- |
Source: Public Records
Mortgage History
| Date | Status | Borrower | Loan Amount |
|---|---|---|---|
| Open | Dolby William J | $50,000 | |
| Closed | Dolby William J | $70,000 |
Source: Public Records
Tax History
| Year | Tax Paid | Tax Assessment Tax Assessment Total Assessment is a certain percentage of the fair market value that is determined by local assessors to be the total taxable value of land and additions on the property. | Land | Improvement |
|---|---|---|---|---|
| 2025 | $4,730 | $361,900 | $102,000 | $259,900 |
| 2024 | $4,429 | $288,900 | $85,000 | $203,900 |
| 2023 | $4,264 | $288,900 | $85,000 | $203,900 |
| 2022 | $4,140 | $189,400 | $54,400 | $135,000 |
| 2021 | $4,072 | $189,400 | $54,400 | $135,000 |
| 2020 | $3,900 | $189,400 | $54,400 | $135,000 |
| 2019 | $3,792 | $189,400 | $54,400 | $135,000 |
| 2018 | $3,192 | $139,500 | $36,700 | $102,800 |
| 2017 | $3,121 | $139,500 | $36,700 | $102,800 |
| 2016 | $3,105 | $139,500 | $36,700 | $102,800 |
| 2015 | $3,119 | $135,900 | $36,400 | $99,500 |
| 2014 | $3,119 | $135,900 | $36,400 | $99,500 |
Source: Public Records
Map
Nearby Homes
- 72 Stowe Ave
- 41 White Ave
- 33 Pine St Unit 35
- 103 Burnside Ave
- 14 Winthrop St
- 10 Booth Ave
- 15 Claire St
- 129 Shore Rd
- 14 Benedict St
- 28 Jefferson Ave
- 25 Winslow St
- 25 Arnold St
- 0 Carousel Dr
- 151 Willett Ave Unit 2
- 85 Hilton Ave
- 916 Bullocks Pt Ave
- 15 Plaza Dr
- 43 Bullocks Point Ave Unit 4A
- 33 Bullocks Point Ave Unit 5C
- 25 Bullocks Point Ave Unit 5C
Your Personal Tour Guide
Ask me questions while you tour the home.