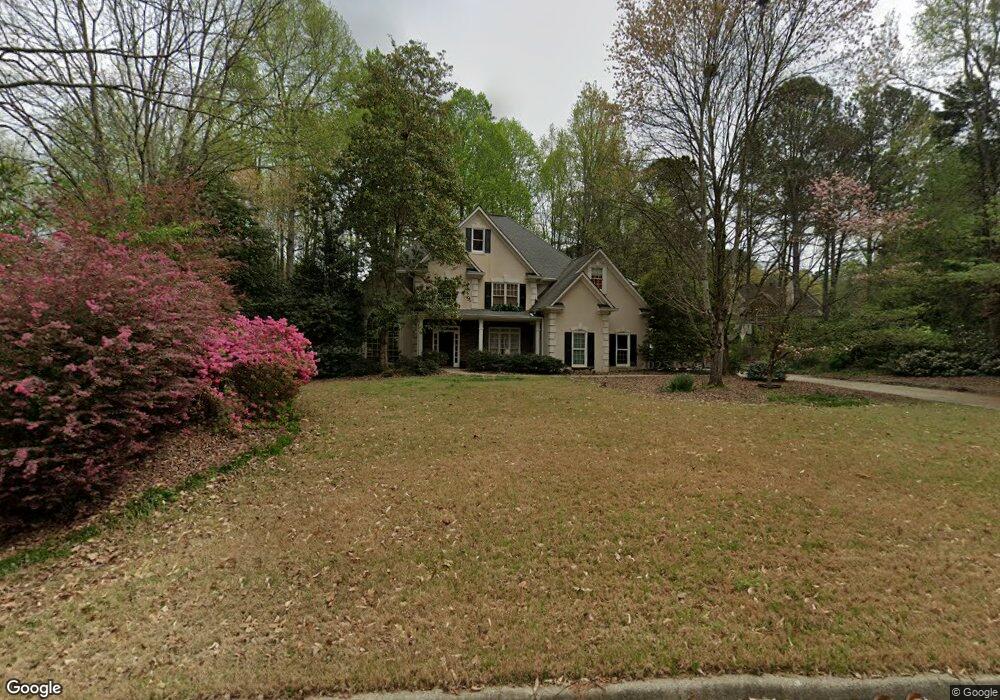
870 Dockbridge Way Alpharetta, GA 30004
Estimated Value: $921,000 - $1,062,000
4
Beds
4
Baths
3,347
Sq Ft
$294/Sq Ft
Est. Value
About This Home
This home is located at 870 Dockbridge Way, Alpharetta, GA 30004 and is currently estimated at $983,365, approximately $293 per square foot. 870 Dockbridge Way is a home located in Fulton County with nearby schools including Crabapple Crossing Elementary School, Northwestern Middle School, and Milton High School.
Ownership History
Date
Name
Owned For
Owner Type
Purchase Details
Closed on
Jun 25, 2010
Sold by
Neville Josh and Neville Brooke
Bought by
Kelsh Cory B and Kelsh Xiomara
Current Estimated Value
Home Financials for this Owner
Home Financials are based on the most recent Mortgage that was taken out on this home.
Original Mortgage
$176,000
Outstanding Balance
$117,246
Interest Rate
4.77%
Mortgage Type
New Conventional
Estimated Equity
$866,119
Purchase Details
Closed on
Jun 13, 2008
Sold by
Jones Walter M and Jones Jeane C
Bought by
Neville Josh and Neville Brooke
Purchase Details
Closed on
Apr 20, 1995
Sold by
Sharp Dev Inc
Bought by
Jones Walter M Jeane
Create a Home Valuation Report for This Property
The Home Valuation Report is an in-depth analysis detailing your home's value as well as a comparison with similar homes in the area
Home Values in the Area
Average Home Value in this Area
Purchase History
| Date | Buyer | Sale Price | Title Company |
|---|---|---|---|
| Kelsh Cory B | $410,000 | -- | |
| Neville Josh | $405,000 | -- | |
| Jones Walter M Jeane | $261,400 | -- |
Source: Public Records
Mortgage History
| Date | Status | Borrower | Loan Amount |
|---|---|---|---|
| Open | Kelsh Cory B | $176,000 | |
| Closed | Jones Walter M Jeane | $0 |
Source: Public Records
Tax History Compared to Growth
Tax History
| Year | Tax Paid | Tax Assessment Tax Assessment Total Assessment is a certain percentage of the fair market value that is determined by local assessors to be the total taxable value of land and additions on the property. | Land | Improvement |
|---|---|---|---|---|
| 2025 | $842 | $313,960 | $93,040 | $220,920 |
| 2023 | $9,053 | $320,720 | $78,960 | $241,760 |
| 2022 | $4,463 | $201,320 | $57,000 | $144,320 |
| 2021 | $4,459 | $195,440 | $55,320 | $140,120 |
| 2020 | $4,510 | $193,120 | $54,680 | $138,440 |
| 2019 | $795 | $180,640 | $36,200 | $144,440 |
| 2018 | $4,639 | $176,440 | $35,360 | $141,080 |
| 2017 | $4,146 | $154,040 | $25,960 | $128,080 |
| 2016 | $4,145 | $154,040 | $25,960 | $128,080 |
| 2015 | $4,819 | $154,040 | $25,960 | $128,080 |
| 2014 | $4,331 | $154,040 | $25,960 | $128,080 |
Source: Public Records
Map
Nearby Homes
- 12842 Waterside Dr Unit 2
- 143 Nakomis Place
- 85 Arabian Ave Unit 2
- 13015 Morningpark Cir Unit 1
- 13025 Morningpark Cir
- 12857 Waterside Dr
- 13125 Morningpark Cir
- 257 Lask Ln
- 249 Lask Ln
- 245 Lask Ln
- 237 Lask Ln
- 233 Lask Ln
- 216 Lask Ln
- 507 Branyan Trail
- 13150 New Providence Rd
- 580 Stillhouse Ln Unit 2
- 12655 New Providence Rd
- 137 Quinn Way
- 127 Quinn Way
- 12950 New Providence Rd
- 860 Dockbridge Way
- 325 Petersford Way
- 850 Dockbridge Way Unit II
- 845 Dockbridge Way Unit 2
- 335 Petersford Way
- 315 Petersford Way
- 0 Petersford Way
- 445 Kensington Dr
- 855 Dockbridge Way Unit 2
- 835 Dockbridge Way Unit 2
- 345 Petersford Way
- 840 Dockbridge Way
- 310 Petersford Way
- 445 Kensington Farms Dr Unit 2
- 425 Kensington Farms Dr Unit 2
- 435 Kensington Farms Dr Unit 2
- 355 Petersford Way
- 865 Dockbridge Way Unit 2
- 320 Petersford Way
- 825 Dockbridge Way Unit II