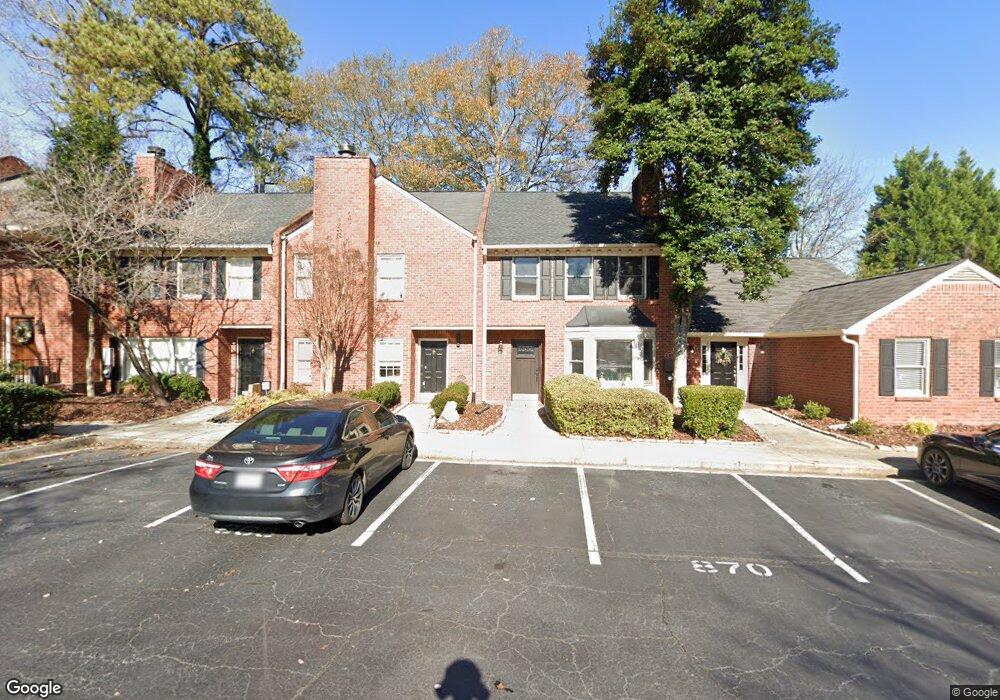
870 Lenox Oaks Cir NE Atlanta, GA 30324
Pine Hills NeighborhoodEstimated Value: $299,000 - $379,000
2
Beds
3
Baths
1,560
Sq Ft
$214/Sq Ft
Est. Value
About This Home
This home is located at 870 Lenox Oaks Cir NE, Atlanta, GA 30324 and is currently estimated at $334,608, approximately $214 per square foot. 870 Lenox Oaks Cir NE is a home located in Fulton County with nearby schools including Smith Elementary School, Sutton Middle School, and North Atlanta High School.
Ownership History
Date
Name
Owned For
Owner Type
Purchase Details
Closed on
Jan 10, 2007
Sold by
Venkatraman Giridhar
Bought by
Hagy William R
Current Estimated Value
Home Financials for this Owner
Home Financials are based on the most recent Mortgage that was taken out on this home.
Original Mortgage
$155,200
Interest Rate
6.07%
Mortgage Type
New Conventional
Purchase Details
Closed on
Oct 20, 2000
Sold by
Neils John J and Neils Sonja W
Bought by
Venkatraman Giridhar
Home Financials for this Owner
Home Financials are based on the most recent Mortgage that was taken out on this home.
Original Mortgage
$21,350
Interest Rate
7.93%
Mortgage Type
New Conventional
Purchase Details
Closed on
Jun 5, 1998
Sold by
Rahman Mushfequr
Bought by
Neils John J and Neils Sonja
Home Financials for this Owner
Home Financials are based on the most recent Mortgage that was taken out on this home.
Original Mortgage
$94,800
Interest Rate
7.23%
Mortgage Type
New Conventional
Create a Home Valuation Report for This Property
The Home Valuation Report is an in-depth analysis detailing your home's value as well as a comparison with similar homes in the area
Home Values in the Area
Average Home Value in this Area
Purchase History
| Date | Buyer | Sale Price | Title Company |
|---|---|---|---|
| Hagy William R | $194,000 | -- | |
| Venkatraman Giridhar | $213,500 | -- | |
| Neils John J | $118,500 | -- |
Source: Public Records
Mortgage History
| Date | Status | Borrower | Loan Amount |
|---|---|---|---|
| Closed | Hagy William R | $155,200 | |
| Previous Owner | Venkatraman Giridhar | $21,350 | |
| Previous Owner | Neils John J | $94,800 |
Source: Public Records
Tax History Compared to Growth
Tax History
| Year | Tax Paid | Tax Assessment Tax Assessment Total Assessment is a certain percentage of the fair market value that is determined by local assessors to be the total taxable value of land and additions on the property. | Land | Improvement |
|---|---|---|---|---|
| 2025 | $3,892 | $116,200 | $15,560 | $100,640 |
| 2023 | $4,388 | $106,000 | $18,640 | $87,360 |
| 2022 | $11,623 | $106,000 | $18,640 | $87,360 |
| 2021 | $3,295 | $116,120 | $18,640 | $97,480 |
| 2020 | $3,261 | $79,600 | $9,400 | $70,200 |
| 2019 | $342 | $79,600 | $9,400 | $70,200 |
| 2018 | $3,101 | $88,120 | $9,400 | $78,720 |
| 2017 | $3,422 | $79,240 | $11,040 | $68,200 |
| 2016 | $3,431 | $79,240 | $11,040 | $68,200 |
| 2015 | $3,777 | $79,240 | $11,040 | $68,200 |
| 2014 | $2,947 | $65,000 | $9,160 | $55,840 |
Source: Public Records
Map
Nearby Homes
- 6 Alston Place NE
- 8 Alston Place NE
- 890 West Rd
- 2921 Lenox Rd NE Unit 205
- 2921 Lenox Rd NE Unit 113
- 764 Burke Rd NE
- 24218 Plantation Dr NE Unit 218
- 24214 Plantation Dr NE
- 23210 Plantation Dr NE
- 1 Plantation Dr NE Unit B
- 3043 Stone Gate Dr NE
- 24315 Plantation Dr NE Unit 315
- 24311 Plantation Dr NE Unit 311
- 24311 Plantation Dr NE
- 28206 Plantation Dr NE Unit 206
- 28112 Plantation Dr NE
- 27309 Plantation Dr NE Unit 27309
- 717 Lenox Ln
- 868 Lenox Oaks Cir NE
- 872 Lenox Oaks Cir NE
- 866 Lenox Oaks Cir NE
- 864 Lenox Oaks Cir NE
- 863 Embassy Ct NE
- 874 Lenox Oaks Cir NE
- 867 Embassy Ct NE
- 862 Lenox Oaks Cir NE
- 871 Embassy Ct NE
- 0 Lenox Oaks Cir NE Unit 7009704
- 0 Lenox Oaks Cir NE
- 875 Embassy Ct NE
- 875 Embassy Ct NE Unit 875
- 876 Lenox Oaks Cir NE
- 876 Lenox Oaks Cir NE Unit 876
- 860 Lenox Oaks Cir NE
- 878 Lenox Oaks Cir NE
- 878 Lenox Oaks Cir NE Unit 878
- 883 Embassy Ct NE
- 883 Embassy Ct NE Unit 883