870 N 2700 W Layton, UT 84041
Estimated Value: $625,477 - $708,000
3
Beds
3
Baths
3,240
Sq Ft
$206/Sq Ft
Est. Value
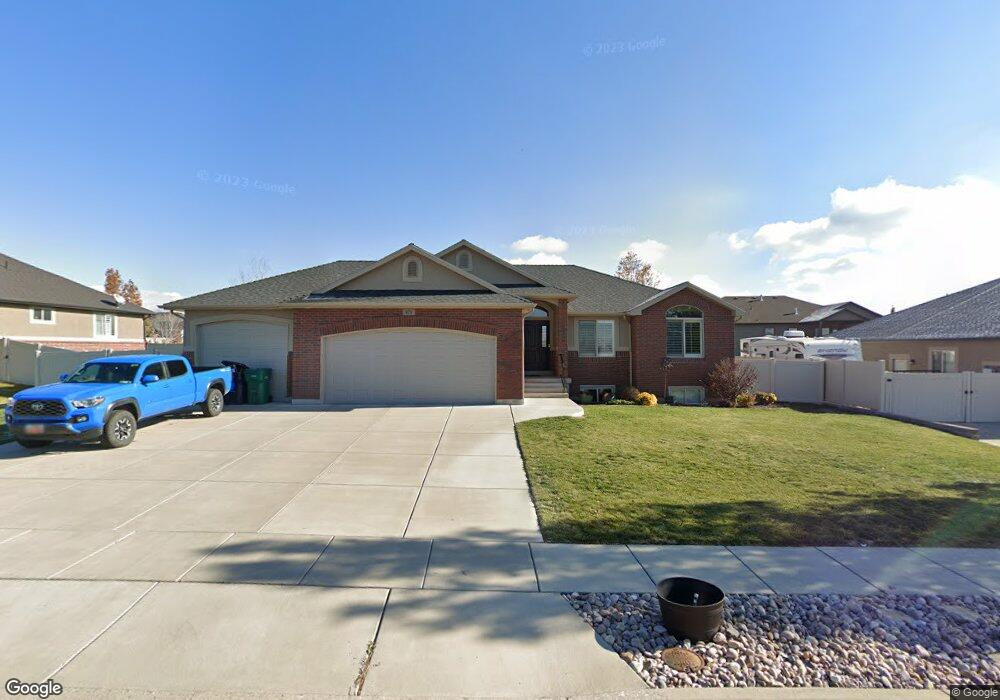
About This Home
This home is located at 870 N 2700 W, Layton, UT 84041 and is currently estimated at $667,619, approximately $206 per square foot. 870 N 2700 W is a home located in Davis County with nearby schools including Ellison Park School, Shoreline Junior High School, and Layton High School.
Ownership History
Date
Name
Owned For
Owner Type
Purchase Details
Closed on
Aug 14, 2020
Sold by
Wilkinson Kirt J and Wilkinson Colleen V
Bought by
Kunz Ryan A and Kunz Vicky Lynn
Current Estimated Value
Home Financials for this Owner
Home Financials are based on the most recent Mortgage that was taken out on this home.
Original Mortgage
$405,820
Outstanding Balance
$323,034
Interest Rate
3%
Mortgage Type
New Conventional
Estimated Equity
$344,585
Purchase Details
Closed on
Apr 18, 2011
Sold by
Ed Green Construction Inc
Bought by
Wilkinson Kirt J and Wilkinson Colleen
Home Financials for this Owner
Home Financials are based on the most recent Mortgage that was taken out on this home.
Original Mortgage
$215,600
Interest Rate
4.83%
Mortgage Type
New Conventional
Purchase Details
Closed on
Mar 30, 2010
Sold by
Swan Meadows Lc
Bought by
Ed Green Construction Inc
Home Financials for this Owner
Home Financials are based on the most recent Mortgage that was taken out on this home.
Original Mortgage
$64,696
Interest Rate
4.88%
Mortgage Type
Seller Take Back
Create a Home Valuation Report for This Property
The Home Valuation Report is an in-depth analysis detailing your home's value as well as a comparison with similar homes in the area
Home Values in the Area
Average Home Value in this Area
Purchase History
| Date | Buyer | Sale Price | Title Company |
|---|---|---|---|
| Kunz Ryan A | -- | First American Title | |
| Wilkinson Kirt J | -- | Security Title Of Da | |
| Ed Green Construction Inc | -- | Security Title Of Davis C |
Source: Public Records
Mortgage History
| Date | Status | Borrower | Loan Amount |
|---|---|---|---|
| Open | Kunz Ryan A | $405,820 | |
| Previous Owner | Wilkinson Kirt J | $215,600 | |
| Previous Owner | Ed Green Construction Inc | $64,696 |
Source: Public Records
Tax History Compared to Growth
Tax History
| Year | Tax Paid | Tax Assessment Tax Assessment Total Assessment is a certain percentage of the fair market value that is determined by local assessors to be the total taxable value of land and additions on the property. | Land | Improvement |
|---|---|---|---|---|
| 2025 | $3,249 | $344,300 | $131,971 | $212,329 |
| 2024 | $3,116 | $329,450 | $141,299 | $188,151 |
| 2023 | $3,042 | $567,000 | $149,354 | $417,646 |
| 2022 | $3,211 | $325,050 | $86,985 | $238,065 |
| 2021 | $2,961 | $447,000 | $130,459 | $316,541 |
| 2020 | $2,797 | $405,000 | $111,450 | $293,550 |
| 2019 | $2,714 | $385,000 | $110,220 | $274,780 |
| 2018 | $2,507 | $357,000 | $97,123 | $259,877 |
| 2016 | $2,356 | $173,085 | $39,988 | $133,097 |
| 2015 | $2,057 | $143,440 | $40,548 | $102,892 |
| 2014 | $2,005 | $142,975 | $40,548 | $102,427 |
| 2013 | -- | $156,750 | $35,924 | $120,826 |
Source: Public Records
Map
Nearby Homes